Download
1 / 1
10 likes | 83 Vues
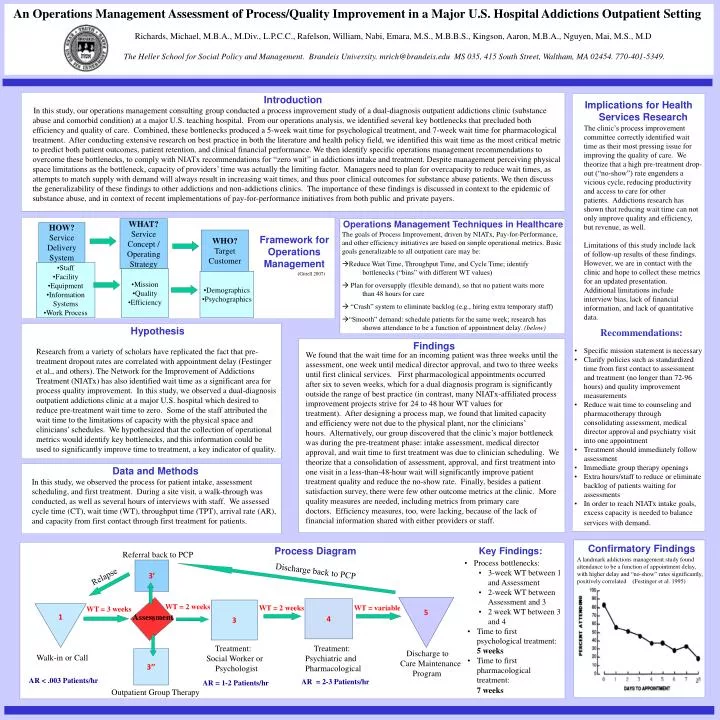
An Operations Management Assessment of Process/Quality Improvement in a Major U.S. Hospital Addictions Outpatient Setting. Richards, Michael, M.B.A., M.Div., L.P.C.C., Rafelson, William, Nabi, Emara, M.S., M.B.B.S., Kingson, Aaron, M.B.A., Nguyen, Mai, M.S., M.D

E N D
An Operations Management Assessment of Process/Quality Improvement in a Major U.S. Hospital Addictions Outpatient Setting Richards, Michael, M.B.A., M.Div., L.P.C.C., Rafelson, William, Nabi, Emara, M.S., M.B.B.S., Kingson, Aaron, M.B.A., Nguyen, Mai, M.S., M.D The Heller School for Social Policy and Management. Brandeis University. mrich@brandeis.edu MS 035, 415 South Street, Waltham, MA 02454. 770-401-5349. Introduction In this study, our operations management consulting group conducted a process improvement study of a dual-diagnosis outpatient addictions clinic (substance abuse and comorbid condition) at a major U.S. teaching hospital. From our operations analysis, we identified several key bottlenecks that precluded both efficiency and quality of care. Combined, these bottlenecks produced a 5-week wait time for psychological treatment, and 7-week wait time for pharmacological treatment. After conducting extensive research on best practice in both the literature and health policy field, we identified this wait time as the most critical metric to predict both patient outcomes, patient retention, and clinical financial performance. We then identify specific operations management recommendations to overcome these bottlenecks, to comply with NIATx recommendations for “zero wait” in addictions intake and treatment. Despite management perceiving physical space limitations as the bottleneck, capacity of providers’ time was actually the limiting factor. Managers need to plan for overcapacity to reduce wait times, as attempts to match supply with demand will always result in increasing wait times, and thus poor clinical outcomes for substance abuse patients. We then discuss the generalizability of these findings to other addictions and non-addictions clinics. The importance of these findings is discussed in context to the epidemic of substance abuse, and in context of recent implementations of pay-for-performance initiatives from both public and private payers. • Implications for Health Services Research • The clinic’s process improvement committee correctly identified wait time as their most pressing issue for improving the quality of care. We theorize that a high pre-treatment drop-out (“no-show”) rate engenders a vicious cycle, reducing productivity and access to care for other patients. Addictions research has shown that reducing wait time can not only improve quality and efficiency, but revenue, as well. • Limitations of this study include lack of follow-up results of these findings. However, we are in contact with the clinic and hope to collect these metrics for an updated presentation. Additional limitations include interview bias, lack of financial information, and lack of quantitative data. • Recommendations: • Specific mission statement is necessary • Clarify policies such as standardized time from first contact to assessment and treatment (no longer than 72-96 hours) and quality improvement measurements • Reduce wait time to counseling and pharmacotherapy through consolidating assessment, medical director approval and psychiatry visit into one appointment • Treatment should immediately follow assessment • Immediate group therapy openings • Extra hours/staff to reduce or eliminate backlog of patients waiting for assessments • In order to reach NIATx intake goals, excess capacity is needed to balance services with demand. Operations Management Techniques in Healthcare WHAT? Service Concept / Operating Strategy HOW? Service Delivery System • The goals of Process Improvement, driven by NIATx, Pay-for-Performance, and other efficiency initiatives are based on simple operational metrics. Basic goals generalizable to all outpatient care may be: • Reduce Wait Time, Throughput Time, and Cycle Time; identify bottlenecks (“bins” with different WT values) Plan for oversupply (flexible demand), so that no patient waits more than 48 hours for care • “Crash” system to eliminate backlog (e.g., hiring extra temporary staff) • “Smooth” demand: schedule patients for the same week; research has shown attendance to be a function of appointment delay. (below) WHO? Target Customer Framework for Operations Management • Staff • Facility • Equipment • Information Systems • Work Process • Mission • Quality • Efficiency (Gittell 2007) • Demographics • Psychographics Hypothesis Research from a variety of scholars have replicated the fact that pre-treatment dropout rates are correlated with appointment delay (Festinger et al., and others). The Network for the Improvement of Addictions Treatment (NIATx) has also identified wait time as a significant area for process quality improvement. In this study, we observed a dual-diagnosis outpatient addictions clinic at a major U.S. hospital which desired to reduce pre-treatment wait time to zero. Some of the staff attributed the wait time to the limitations of capacity with the physical space and clinicians’ schedules. We hypothesized that the collection of operational metrics would identify key bottlenecks, and this information could be used to significantly improve time to treatment, a key indicator of quality. Findings We found that the wait time for an incoming patient was three weeks until the assessment, one week until medical director approval, and two to three weeks until first clinical services. First pharmacological appointments occurred after six to seven weeks, which for a dual diagnosis program is significantly outside the range of best practice (in contrast, many NIATx-affiliated process improvement projects strive for 24 to 48 hour WT values for treatment). After designing a process map, we found that limited capacity and efficiency were not due to the physical plant, nor the clinicians’ hours. Alternatively, our group discovered that the clinic’s major bottleneck was during the pre-treatment phase: intake assessment, medical director approval, and wait time to first treatment was due to clinician scheduling. We theorize that a consolidation of assessment, approval, and first treatment into one visit in a less-than-48-hour wait will significantly improve patient treatment quality and reduce the no-show rate. Finally, besides a patient satisfaction survey, there were few other outcome metrics at the clinic. More quality measures are needed, including metrics from primary care doctors. Efficiency measures, too, were lacking, because of the lack of financial information shared with either providers or staff. Data and Methods In this study, we observed the process for patient intake, assessment scheduling, and first treatment. During a site visit, a walk-through was conducted, as well as several hours of interviews with staff. We assessed cycle time (CT), wait time (WT), throughput time (TPT), arrival rate (AR), and capacity from first contact through first treatment for patients. • Key Findings: • Process bottlenecks: • 3-week WT between 1 and Assessment • 2-week WT between Assessment and 3 • 2 week WT between 3 and 4 • Time to first psychological treatment: • 5 weeks • Time to first pharmacological treatment: • 7 weeks Confirmatory Findings Process Diagram Referral back to PCP A landmark addictions management study found attendance to be a function of appointment delay, with higher delay and “no-show” rates significantly, positively correlated (Festinger et al. 1995) 3’ Relapse Discharge back to PCP 5 4 3 WT = 2 weeks WT = 2 weeks WT = variable 1 WT = 3 weeks 2 Assessment Treatment: Treatment: Discharge to 3’’ Walk-in or Call Social Worker or Psychiatric and Care Maintenance Psychologist Pharmacological Program AR < .003 Patients/hr AR = 2-3 Patients/hr AR = 1-2 Patients/hr Outpatient Group Therapy