Download
1 / 1
10 likes | 141 Vues
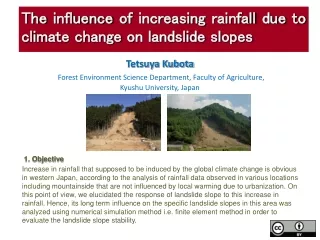
Summer Quasi-Biweekly Oscillation over the Tropical Americas: Spatial Features and Relation with ENSO Min Wen1,2, Song Yang1, R. Wayne Higgins1, and Renhe Zhang2 1NOAA’s Climate Prediction Center, Camp Springs, MD 20746 2Chinese Academy of Meteorological Sciences, Beijing, China. 1.Objective

E N D
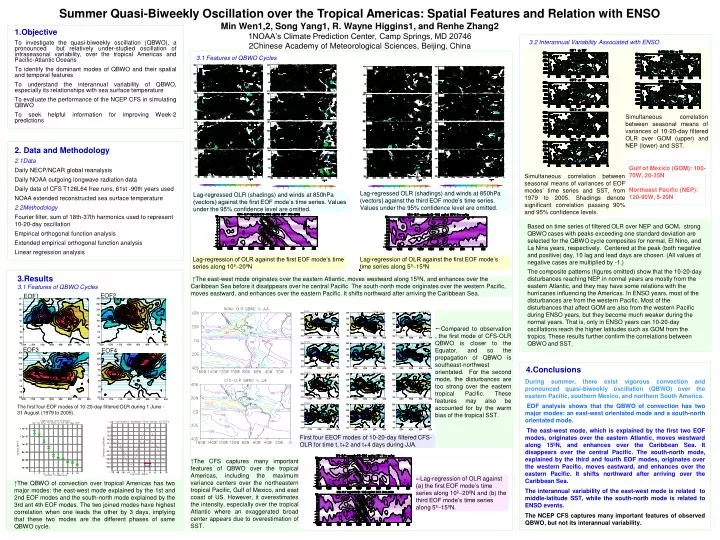
Summer Quasi-Biweekly Oscillation over the Tropical Americas: Spatial Features and Relation with ENSO Min Wen1,2, Song Yang1, R. Wayne Higgins1, and Renhe Zhang2 1NOAA’s Climate Prediction Center, Camp Springs, MD 20746 2Chinese Academy of Meteorological Sciences, Beijing, China 1.Objective To investigate the quasi-biweekly oscillation (QBWO), a pronounced but relatively under-studied oscillation of intraseasonal variability, over the tropical Americas and Pacific-Atlantic Oceans To identify the dominant modes of QBWO and their spatial and temporal features To understand the interannual variability of QBWO, especially its relationships with sea surface temperature To evaluate the performance of the NCEP CFS in simulating QBWO To seek helpful information for improving Week-2 predictions 3.2 Interannual Variability Associated with ENSO. Simultaneous correlation between seasonal means of variances of EOF modes’ time series and SST, from 1979 to 2005. Shadings denote significant correlation passing 90% and 95% confidence levels. Simultaneous correlation between seasonal means of variances of 10-20-day filtered OLR over GOM (upper) and NEP (lower) and SST. 3.1 Features of QBWO Cycles 2. Data and Methodology 2.1Data Daily NECP/NCAR global reanalysis Daily NOAA outgoing longwave radiation data Daily data of CFS T126L64 free runs, 61st -90th years used NOAA extended reconstructed sea surface temperature 2.2Methodology Fourier filter, sum of 18th-37th harmonics used to represent 10-20-day oscillation Empirical orthogonal function analysis Extended empirical orthogonal function analysis Linear regression analysis Gulf of Mexico (GOM): 100-70W, 20-35N Northeast Pacific (NEP): 120-90W, 5-20N Lag-regressed OLR (shadings) and winds at 850hPa (vectors) against the third EOF mode’s time series. Values under the 95% confidence level are omitted. Lag-regressed OLR (shadings) and winds at 850hPa (vectors) against the first EOF mode’s time series. Values under the 95% confidence level are omitted. Based on time series of filtered OLR over NEP and GOM, strong QBWO cases with peaks exceeding one standard deviation are selected for the QBWO cycle composites for normal, El Nino, and La Nina years, respectively. Centered at the peak (both negative and positive) day, 10 lag and lead days are chosen. (All values of negative cases are multiplied by -1.) The composite patterns (figures omitted) show that the 10-20-day disturbances reaching NEP in normal years are mostly from the eastern Atlantic, and they may have some relations with the hurricanes influencing the Americas. In ENSO years, most of the disturbances are from the western Pacific. Most of the disturbances that affect GOM are also from the western Pacific during ENSO years, but they become much weaker during the normal years. That is, only in ENSO years can 10-20-day oscillations reach the higher latitudes such as GOM from the tropics. These results further confirm the correlations between QBWO and SST. Lag-regression of OLR against the first EOF mode’s time series along 10º20ºN Lag-regression of OLR against the first EOF mode’s time series along 5º15ºN 3.Results 3.1 Features of QBWO Cycles ↑The east-west mode originates over the eastern Atlantic, moves westward along 15ºN, and enhances over the Caribbean Sea before it disatppears over he central Pacific. The south-north mode originates over the western Pacific, moves eastward, and enhances over the eastern Pacific. It shifts northward after arriving the Caribbean Sea. EOF2 EOF1 ←Compared to observation , the first mode of CFS-OLR QBWO is closer to the Equator, and so the propagation of QBWO is southeast-northwest orientated. For the second mode, the disturbances are too strong over the eastern tropical Pacific. These features may also be accounted for by the warm bias of the tropical SST. EOF3 EOF4 4.Conclusions During summer, there exist vigorous convection and pronounced quasi-biweekly oscillation (QBWO) over the eastern Pacific, southern Mexico, and northern South America. EOF analysis shows that the QBWO of convection has two major modes: an east-west orientated mode and a south-north orientated mode. The east-west mode, which is explained by the first two EOF modes, originates over the eastern Atlantic, moves westward along 15ºN, and enhances over the Caribbean Sea. It disappears over the central Pacific. The south-north mode, explained by the third and fourth EOF modes, originates over the western Pacific, moves eastward, and enhances over the eastern Pacific. It shifts northward after arriving over the Caribbean Sea. The interannual variability of the east-west mode is related to middle-latitude SST, while the south-north mode is related to ENSO events. The NCEP CFS captures many important features of observed QBWO, but not its interannual variability. The first four EOF modes of 10-20-day filtered OLR during 1 June - 31 August (1979 to 2005). First four EEOF modes of 10-20-day filtered CFS-OLR for time t, t+2 and t+4 days during JJA. ↑The CFS captures many important features of QBWO over the tropical Americas, including the maximum variance centers over the northeastern tropical Pacific, Gulf of Mexico, and east coast of US. However, it overestimates the intensity, especially over the tropical Atlantic where an exaggerated broad center appears due to overestimation of SST. ←Lag-regression of OLR against (a) the first EOF mode’s time series along 10º20ºN and (b) the third EOF mode’s time series along 5º15ºN. ↑The QBWO of convection over tropical Americas has two major modes: the east-west mode explained by the 1st and 2nd EOF modes and the south-north mode explained by the 3rd ant 4th EOF modes. The two joined modes have highest correlation when one leads the other by 3 days, implying that these two modes are the different phases of same QBWO cycle.