Download
1 / 18
180 likes | 259 Vues
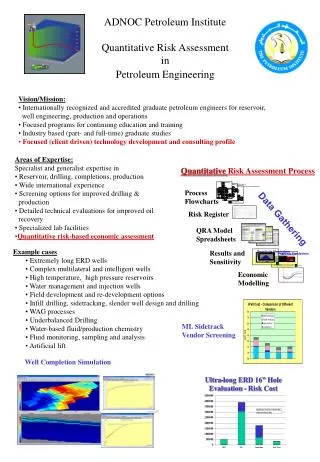
Ensuring Success in Integrity Management Marty Matheson American Petroleum Institute July 24, 2002. Our vision is an oil pipeline industry that --. conducts operations safely and with respect for the environment; respects the privilege to operate granted to it by the public; and

E N D
Ensuring Success in Integrity ManagementMarty MathesonAmerican Petroleum InstituteJuly 24, 2002
Our vision is an oil pipeline industry that -- • conducts operations safely and with respect for the environment; • respects the privilege to operate granted to it by the public; and • provides reliable transportation of the crude oil and refined products upon which America and all Americans rely.
The History: Improving Record, 1968-2001 First six years, Annl Avg: 359 spills; 368,000 barrels Last six years, Annl Avg: 160 spills; 145,000 barrels Source: Allegro Energy Group from RSPA 7000-1. Updated 3/27/02.
Overview --Measuring Effectiveness: • Understanding past performance • Creating new measures for future performance • Surveying operator plans for inspections • Identifying potential barriers to success and taking action
Pipeline Performance Tracking System – A Voluntary Effort • Incidents down to 5 gallons • 20 cause categories based on ASME • Detail, detail, detail • Over 140,000 miles of pipe or more than 90% of regulated mileage • Infrastructure information • Miles by diameter • Miles by decade of construction, etc.
New Infrastructure Data Elements • System Mileage By Commodity Transported • Crude oil • Refined products • HVLs • CO2 and other gases VALUE: Provides data for conducting analyses for separate aspects of the industry
New Infrastructure Data Elements • System Mileage That “Could Affect” High Consequence Areas (line pipe) • Facilities That “Could Affect” High Consequence Areas (tanks, pumps, etc.) • VALUE: Trend analysis of incidents in HCAs versus incidents in non-HCAs
New Infrastructure Data Elements • Mileage inspected by ILI • Corrosion or metal loss tool| Dent or deformation tool Crack or long seam defect tool | Any other ILI tool • Actions taken based on ILI • # Anomalies excavated and inspected | # Conditions identified and repaired | # “immediate repair condition” | # “60-day condition” | # “180-day condition” • Mileage inspected by pressure testing • Actions taken based on pressure testing • # Ruptures | # Leaks | # Test failures repaired • Mileage inspected by other techniques, direct assessment • VALUE: Provides for evaluating the effect of the IMP rules and of company integrity management programs
New Infrastructure Data Elements • Total mileage assessed in calendar year • Total number of conditions repaired or otherwise mitigated • Total baseline assessments completed in calendar year • Risk assessment complete • Inspection complete (tools/hydro) • Information integrated • Repairs and mitigation complete VALUE: Provides means to evaluate progress toward specific IMP rulemaking goals
New Incident Data Elements • Did this release reach any "high consequence areas“? • If yes, specify below the types of HCA's affected and whether they were identified or not identified in your Integrity Management Program. • Com. navigable waterway ___identified ___not identified • High population area ___identified ___not identified • Other populated area ___identified ___not identified • Unusually Sensitive Area – Water ___identified ___not identified • Unusually Sensitive Area – Ecol. ___identified ___not identified VALUE: Provides data for evaluating HCA definitions and their application
What Should You Be Doing to Measure Performance? • Collect information about your integrity performance • Participate in PPTS • Collect consistent information even if you don’t participate in PPTS
Survey of Company Plans on ILI • Over the 7 year baseline period • 112,000 miles included in the survey • 70% of interstate oil pipeline mileage regulated by OPS
Context Information • Between 85-90% of oil pipeline mileage is currently capable of being inspecting using ILI technology • Does not represent all forms of inspection, just IL • No hydrotest or direct assessment information
Goals • More integrity assessments • In HCAs • Beyond HCAs • Improving integrity management within companies • Improving the government’s role in reviewing the adequacy of plans • Providing increased public assurance
The History: Improving Record, 1968-2001 First six years, Annl Avg: 359 spills; 368,000 barrels Last six years, Annl Avg: 160 spills; 145,000 barrels Source: Allegro Energy Group from RSPA 7000-1. Updated 3/27/02.