Download
1 / 32
330 likes | 529 Vues
Organic Molecules in the Low-Mass Protostellar System NGC 1333 IRAS 4A Jeff Pedelty (GSFC) Lee Mundy (U Md) Steve Charnley (SETI). Geometry. Spectrum. Like IRAS 16293-2422, IRAS 4A is one of the youngest protostars known: a Class 0 in the Perseus star forming region ~220 pc away.

E N D
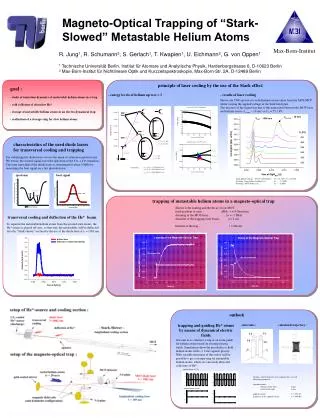
Organic Moleculesin the Low-Mass Protostellar SystemNGC 1333 IRAS 4AJeff Pedelty (GSFC)Lee Mundy (U Md)Steve Charnley (SETI)
Geometry Spectrum Like IRAS 16293-2422, IRAS 4A is one of the youngest protostars known: a Class 0 in the Perseus star forming region ~220 pc away
Overview of NGC 1333 IRAS 4A BIMA l2.7mm continuum emission 5" 3" Class 0/Extreme Class 1 Extensive CSO, JCMT survey (Blake, Mundy et al. 1995) Detection of methyl formate, methyl cyanide, formic acid. => hot molecular core(s) (Bottinelli, l1-3mm, IRAM) 0.6" 1.1" A2 A1 A2 ~400 AU A1 Looney, Mundy, Welch, 2000, ApJ, 529, 477.
A2 A1 Very Large Array l7mm Continuum Map • Data acquired November, 2005 • Dn = ~3 MHz • Resolution of 1.6” circular (natural weighting) • Just resolving A into A1 and A2 • ~Same spatial resolution as Submillimeter Array (SMA) and Plateau de Bure Interferometer (PdBI) • VLA’s most compact configuration A ~6600 AU B
Map & Spectrum of Formic Acid in IRAS 4A • HCOOH transition 202 - 101 (44.9 GHz) • We detect in source A2 but not A1 • Column density: ~1-2 x 1015 cm-2 (Trot=60-100K) • Formic acid and glycine share carboxyl group and may share formation pathway • Formic acid is part of possible glycine formation mechanism (Charnley): NH2CH2OH2+ + HCOOH NH2CH2COOH2+ + H2O A2 A1
VLA Map and Spectrum of Methyl Formate • HCOOCH3 transition 414-313 (~44.5 GHz) • We detect in source A1 and A2, but >4x greater line strength in A1. • Column density in A1: ~3-5 x 1015 cm-2 (Trot=60-100K) • Methyl formate is largish (8-atom) molecule (isomer of both acetic acid and glycolaldehyde) • Acetic acid is part of another possible glycine formation mechanism: <E + A> A2 A1 E A CO + OH COOH CH3 + COOH CH3COOH NH2 + CH3COOH NH2CH2COOH + H
Year in Review • Support • Continued as GCA representative on IT Working Group • Maintained PolyCom videoconferencing and WebEx presentation sharing capabilities at GSFC • Implementing new first-class videoconferencing facility for GCA • Outreach • Supported year-end presentations by GCA summer students • Science • VLA l7mm observations of organic molecules in low-mass protostellar system NGC 1333 IRAS 4A (w/ Mundy & Charnley) • Presented VLA results on IRAS 16293-2422 to NAI 2005 General Meeting • Presenting IRAS 4A results to AbSciCon 2006 • Co-I on Meadows’ NAI proposal for Virtual Planetary Laboratory development • Using Earth remote sensing data for VPL development and Earthshine application • Using thermal remote sensing data for monitoring temperature of Boiling Springs Lake in Lassen Volcanic National Park in support of NAI Virus Focus Group research
Earth Remote Sensing Data in Support of Earthshine Analyses Normalized Difference Vegetation Index (NDVI) for last two years as measured by MODIS
Surface Reflectance at ~0.8mm for December 2005 as measured by MODIS
ASTER VNIR Landsat TIR Remote Sensing of Boiling Springs LakeLassen Volcanic National Park Goal is temperature monitoring of lakeHow much does lake cool during the winter? ASTER VNIR
~800 AU Overview of IRAS 16293-2422 Solid contours show ionized gas emission (Wootten, l6cm Very Large Array) Dashed contours show cold dust emission (Mundy, l3mm Owens Valley) Rich inventory of organicmolecules such as ethyl & vinyl cyanide, acetic acid, formic acid, methyl formate, cyclopropenylidene etc. => hot molecular core(s) (Cazaux, l1mm, IRAM single dish) Actively studied ~20 years, including GCA members. Source B(~0.61 Msun) Source A(~0.49 Msun)
Protoplanetary Disk in Source BVery Large Array (VLA) l7mm continuum image A array resolution ~0.05˝ x 0.1˝ Rodriguez et al., ApJ (in press)
Single dish observations were too low in resolution to distinguish between source A and B. Goals of our Very Large Array (VLA) l7mm observations were to locate the hot molecular core in either source A or B (or both), confirm that core(s) were compact, and determine improved abundances and temperatures. When we submitted our proposal no high resolution maps of prebiotic organic molecules in this source had been published.
Submillimeter Array (SMA) Observations(Kuan, Huang, Charnley* et al. Nov. 2004) B Reveal two diverse molecular cores A
Source A Source B Lines in source A are much wider than in source B: ~8 km/sec vs. ~2 km/sec Indicative of different dynamical states.
Methyl formate emission Dust emission (l1.3mm) Plateau de Bure Interferometer (PdBI) Results (Bottinelli, Dec. 2004) B B A A
B A Our Very Large Array l7mm Continuum Map • Resolution ~SMA and PdBI (VLA’s most compact config.) • Flux density in source B matches 0.1˝ image, thus source is compact on scale ~30 AU 800 AU
First Interferometric Imaging of Formic Acid in IRAS 16293 • HCOOH transition 202 - 101 (44.9 GHz) • We detect in source B but not A • Column density: ~3-7 x 1015 cm-2 (Trot=60-109K) • Formic acid and glycine share carboxyl group and may share formation pathway • Formic acid is part of possible glycine formation mechanism (Charnley): NH2CH2OH2+ + HCOOH NH2CH2COOH2+ + H2O
<A+E> A E Our VLA Map of New Methyl Formate Transition • HCOOCH3 transition 414-313 (~44.5 GHz) • We again detect in source B but not A • Methyl formate is largish (8-atom) molecule (isomer of both acetic acid and glycolaldehyde) • Acetic acid is part of another possible glycine formation mechanism: CO + OH COOH CH3 + COOH CH3COOH NH2 + CH3COOH NH2CH2COOH + H
Kuan et al. noted possible transitional state or mis-ID Preliminary Methyl Formate Rotation Diagram for Source B Our density is ~25x greaterthan Kuan et al.’s estimate.
VLA Searches for Glycine in OMC-1 and SgrB2 and Related Molecular Studies • Summary of results from two 2003 papers in the Astrophysical Journal: • “A Sensitive Very Large Array (VLA) Search For Small-Scale Glycine Emission Toward OMC-1,” J. M. Hollis, J. A. Pedelty, L. E. Snyder, P. R. Jewell, F. J. Lovas, P. Palmer, and S.-Y. Liu. 2003, Astrophysical Journal, 588, 353. • “Kinematics of the Sagittarius B2(N-LMH) Molecular Core,” J. M. Hollis, J. A. Pedelty, L. E. Snyder, D. A. Boboltz, S.-Y. Liu, L. E. Snyder, P. Palmer, F. J. Lovas, and P. R. Jewell. 2003, Astrophysical Journal (Letters), 596, L235.
Comparison of MF Rotation Diagrams Exclusion of doublet at 454 K would improve Kuan et al. fit,as they noted.
EtCN in Sagittarius B2 (2 compact emission regions in the LMH) 0.1pc Rotating Gas Disk with ~2600 Solar Masses
Images of Methyl Formate (Note the nearly identical appearance of the A and E symmetry states, as expected)
Laboratory Frequencies are Essential • The difference between a detection of glycine and U43751.5 is 12 channels = 2.5 MHz Dn=2.5 MHz