Download
1 / 13
130 likes | 483 Vues
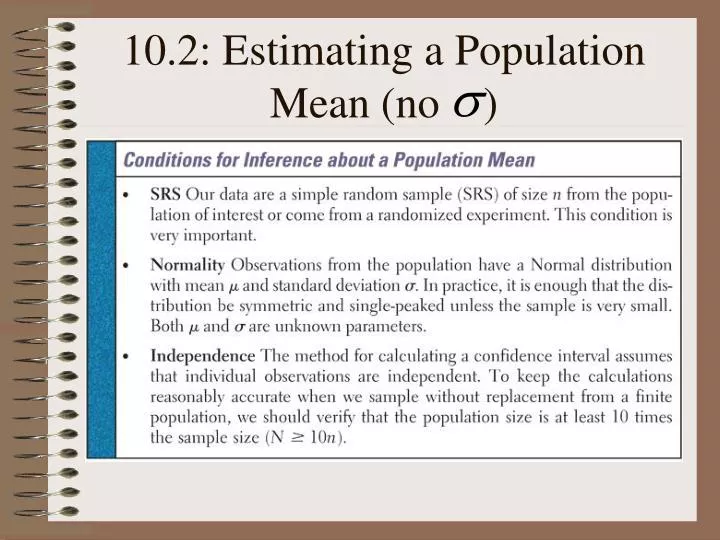
10.2: Estimating a Population Mean (no ). You are estimating the standard deviation , but there will likely be some error involved because you are estimating it from sample data. Resulting distribution = t distribution Specify a particular t distribution by degrees of freedom

E N D
You are estimating the standard deviation, but there will likely be some error involved because you are estimating it from sample data. • Resulting distribution = t distribution • Specify a particular t distribution by degrees of freedom • Notation: t(k)
Similar in shape to the standard Normal curve The spread is a bit greater than the standard Normal curve As degrees of freedom (k) increases, the t(k) density curve approaches the N(0,1) curve more closely T distribution features
Got Milk? A milk processor monitors the number of bacteria per milliliter in raw milk received for processing. A random sample of 10 one-milliliter specimens from milk supplied by one producer gives the following data: • 4890 5100 4500 5260 5150 4900 4760 4700 4870 Find a 90% CI for the mean number of bacteria per milliliter in all the milk from this supplier.
When the actual df does not appear in Table C, use the greatest df available that is less than your desired df. Rounding down in Table C will widen the interval which will safely contain the exact interval. When degrees of freedom are hard to find
Recall: Matched pairs are a form of block design in which just two treatments are compared. Subjects are matched in pairs and each treatment is given to one subject in each pair Alternatively, each subject receives both treatments in some order. • Comparative studies are more convincing than single-sample investigations
Ex. 10.10, p. 651 • Our subjects are 11 people diagnosed as being dependent on caffeine. Each subject was barred from caffeine; instead, they took capsules containing their normal caffeine intake. During a different time period, they took placebo capsules. The order in which subjects took caffeine and the placebo was randomized. • “Depression” is the score on the Beck Depression Inventory. Higher scores = higher depression. We are interested in whether or not caffeine deprivation affects these outcomes. • Construct a 90% confidence interval for the mean change in depression score.
Matched pairs problem (same individual received both treatments) Study looking to provide evidence that withholding caffeine from caffeine-dependent individuals may lead to depression
Random selection vs. Random assignment • Experiments are rarely done on randomly selected subjects; the purpose is often to compare 2 treatments rather than to generalize to a larger population. • Random selection = allows us to generalize • Random assignment = allows us to compare treatments
National Fuelsaver Corporation manufactures the Platinum Gasaver, a device they claim “may increase gas mileage by 22%.” Here are the percent changes in gas mileage for 15 identical vehicles, as presented in one of the company’s advertisements: 48.3 46.9 46.8 44.6 40.2 38.5 34.6 33.7 28.7 28.7 24.8 10.8 10.4 6.9 12.4 1. Construct and interpret a 90% confidence interval to estimate the mean fuel savings in the population of all such vehicles. Follow the Inference Toolbox. 2. Explain what “90% confidence” means in this setting. 3. Comment on the manufacturer’s claim based on your work in Question 1.