Download
1 / 23
250 likes | 552 Vues
Independent & Dependent Variables. Independent variable : A variable thought to be the cause of some effect. Used in experimental research to denote a variable that the experimenter manipulated.

E N D
Independent & Dependent Variables • Independent variable: A variable thought to be the cause of some effect. Used in experimental research to denote a variable that the experimenter manipulated. • Dependent variable: A variable thought to be affected by changes in the independent variable. This is the outcome variable. • Predictor variable: A variable thought to predict an outcome variable. Basically an independent variable. • Outcome variable: A variable thought to change as a function of change in a predictor variable.
Identify Independent & Dependent Variables • The purpose of this experiment was to determine the effects of exercise on body fat. • The purpose of this experiment was to determine the effects of power training on vertical jump. • The purpose of this experiment was to determine the relationship between diet and body composition.
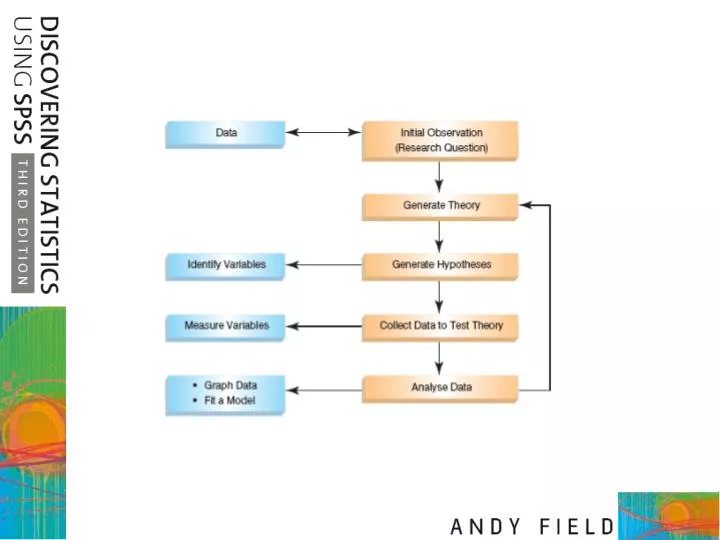
From your initial observation you generate explanations, or theories, of those observations, from which you can make predictions (hypotheses). Scientific statements are ones that can be verified (tested) using empirical evidence.
Levels of Measurement • Categorical • Binary variable: Only 2 categories (male, female) • Nominal variable: More than two categories: young, middle age, elderly. • Ordinal variable: The variable is ordered by some attribute, such as pain. (each interval does not represent and EQUAL distance). Ex: RPE & Pain ratings • Continuous • Interval variable: Equal intervals on the variable represent an equal difference. Temperature is an interval variable. • Ratio variable: Equal intervals represent equal difference. Zero is an absence of the variable, ratio values are meaningful.
Measurement Error • Measurement error is the discrepancy between a variables actual value and its measured value. • Some variables more prone to errors than others: attitude, pain, volume of gas expired, blood pressure, height and weight. • Factors that can influence measurement error: • Accuracy of instruments • Random variation in the variable • Adherence to sound measurement principles
Validity and Reliability • Validity refers to whether an instrument actually measures what it is designed to measure. • DEXA, hydrostatic, and skinfolds can all measure the percent body fat. DEXA has the highest validity of the three. • Reliability refers to the consistency of the instrument. • The easiest way to test reliability is to measure the same people twice (test-retest reliability).
Correlational vs Experimental Research • In correlational research we observe what goes on without directly interfering with it. • Ex: what is the relationship between anxiety and performance? • In experimental research we manipulate one variable to see its effects on another. • Ex: What is the effect of caffeine on reaction time?
Experimental Research • Confounding variable: a variable that we may or may not have measured other than the predictor variables, that potentially affects the outcome. • Counterbalanced: the process of systematically varying the order of conditions. ½ begin with cond 1, ½ begin with cond 2. • Randomization: random assignment of subjects to different groups. [Be sure you understand the difference between counterbalanced and randomization] • The goal in experimental research is to rule out all confounding variables so that any changes in the dependent variable can be attributed to the treatment.
Experimental Research (con’t) • Two methods of data collection • Using different groups of subjects in each condition. Referred to as: a between-groups, between-subjects, or independent groups design. • Using the same subjects in each condition. Referred to as: a within-subjects or repeated measures design.
Sources of Variation • Systematic variation: variation due to experimental manipulation. • Effects of caffeine on heart rate. The drug caffeine should cause variation if all confounding variables are controlled. • Unsystematic variation (Random Variation): variation that exists between experimental conditions (such as differences in ability, time of day, etc). • Some subjects will be affected by caffeine more than others.
Statistics Quantifies Systematic & Unsystematic Variation • The role of statistics is to discover how much variation there is in performance, and then partition the variance to systematic and unsystematic (random). • In repeated measures designs, differences between two conditions can be caused by: • Manipulation (treatment) applied • Or any other factor that affects performance over time. • In an independent design, differences between two conditions can be caused by: • Manipulation (treatment) applied • Differences in the subjects that are Randomly Assigned to the treatment groups. • The error variation is always greater in an independent design.
Randomization • Randomization is important because it eliminates most other sources of systematic variation. • In a repeated-measures design the two most important sources of systematic variation are: • Practice effects: subjects get better at the test after performing the test on the pre-test. • Boredom effects: subjects perform differently on the post-test because they are bored or fatigued. • Counterbalancing helps to minimize the order effects.
Randomization • In an independent design subjects must be randomly assigned to treatment groups to minimize the effect of confounding variables on systematic variation. • The purpose of this experiment is to determine the effects of a 6-week power training program on jumping power. What will happen if: • 10 Olympic volleyball players were assigned to the power training group, 10 untrained subjects were assigned to the control group. • 10 untrained subjects were assigned to the power training group, 10 Olympic volleyball players were assigned to the control group. • 20 subjects were randomly assigned to either the power training group or the control group.
The normal distribution is symmetrical. The mean, median and mode are all the same value.
The median is the middle score 22, 40, 53, 57, 93, 98, 103, 108, 116, 121, 252 Arrange the scores in ascending order. Count the number of scores, add 1 then divide by 2. (n + 1)/2 = (11 + 1)/2 = 6. 98 is the 6th score, so the median is 98. For an EVEN number of scores take the ave of the middle two scores 22, 40, 53, 57, 93, 98, 103, 108, 116, 121 Arrange the scores in ascending order. Count the number of scores, add 1 then divide by 2. (n + 1)/2 = (10 + 1)/2 = 5.5. (93 + 98)/2 = 95.5 the median is 95.5.
The Mean Compute the mean of 22, 40, 53, 57, 93, 98, 103, 108, 116, 121, 252
The Interquartile Range is the middle 50% of the distribution.
Hypothesis Testing • Null Hypothesis: States the research question indicating that there is no difference. • Alternative Hypothesis or Experimental Hypothesis: States the research question in the direction of the expected change. • We cannot prove the experimental hypothesis, but we can reject the null at some level of probability. • We cannot talk about the null or the experimental hypothesis as being true, we can only talk in terms of the probability of obtaining the results if the null is true. • In reality we have not proved anything, only the likelihood that an outcome may occur.