Download
1 / 55
560 likes | 784 Vues
Phylogenetics 101. Eddie Holmes Center for Infectious Disease Dynamics, Department of Biology, The Pennsylvania State University Fogarty International Center , National Institutes of Health. Modern Phylogenetics. Useful Textbooks & Software. Books:

E N D
Phylogenetics 101 Eddie Holmes Center for Infectious Disease Dynamics, Department of Biology, The Pennsylvania State University Fogarty International Center, National Institutes of Health
Useful Textbooks & Software • Books: • • Page RDM & Holmes EC. (1998). Molecular Evolution: A Phylogenetic Approach. Blackwell Science Ltd, Oxford. • • Lemey P, Salemi M & Vandamme A-M. (2009). The Phylogenetic Handbook, 2nd Edition. Cambridge University Press. • Computer Software: • • BEAST (Bayesian Evolutionary Analysis Sampling Trees) • - http://beast.bio.ed.ac.uk/ • • MEGA (Molecular Evolutionary Genetics Analysis) • http://megasoftware.net/ • • MrBayes (Bayesian inference of phylogeny) • - http://mrbayes.csit.fsu.edu/ • • PhyML (Maximum likelihood phylogenetics) • - http://www.atgc-montpellier.fr/phyml/ • • HyPhy/DATAMONKEY (Selection, recombination & hypothesis testing) • - http://datamonkey.org/ • • RDP3 (Recombination detection program) • - darwin.uvigo.es/rdp/rdp.html • • PAUP* (Phylogenetic Analysis Using Parsimony *and other methods) • http://paup.csit.fsu.edu/
Topics in Evolutionary Inference • Estimating genetic distances between sequences • Inferring phylogenetic trees • Detecting recombination events • The inference of selection pressures (particularly detecting positive selection) • Estimating rates of evolutionary change • Inferring demographic history (population dynamics) • Phylogeography
The Quasispecies Useful summary reference: • Bull JJ, Meyers LA & Lachmann M. (2005). Quasispecies made simple. PLoSComp.Biol. 1:e61.
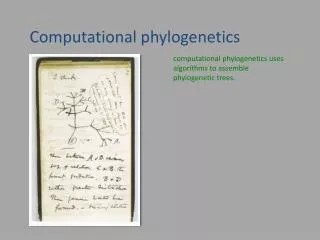
The Quasispecies • • Idea introduced by Manfred Eigen as a mathematical model of early life forms (RNA replicators) based upon chemical kinetics and first used in virology by Esteban Domingo in the 1970s. Now the dominant model in RNA virus evolution. • • A distribution of variant genomes ordered around the fittest sequence (often called the ‘master sequence’) and produced by a combination of mutation and selection (“mutation-selection” balance). Only functions at high mutation rates. • • Only considers intra-host evolution.
The Quasispecies • • The frequency of any variant in the quasispecies is a function of its own replication rate and the probability that it is produced by the erroneous replication of other variants in the population. • • Viral genomes are not independent entities due to mutational coupling (i.e. variants are linked in mutational space).The entire mutant distribution forms an organised structure which acts like (quasi) a single unit (species). • • Natural selection acts on the mutant distribution as a whole, not on individual variants, and the quasispecies evolves to maximise its average replication fitness. So, it is a form of group selection. • • Important implication: low fitness variants can out-compete high fitness variants if they are surrounded by beneficial mutational neighbours (“survival of the flattest”).
The Quasispecies ‘survival of the fittest’ ‘survival of the flattest’
Experimental Verification of Quasispecies Dynamics Population A = red (high replicationrate) Population B = blue (low replicationrate) • However, this only occurs at artificially elevated mutation rates • • Sanjuán R, Cuevas JM, Furió V, Holmes EC & Moya A. (2007). Selection for robustness in mutagenized RNA viruses. PLoS Genet. 3: e93.
Do RNA Viruses Form Quasispecies? • • Most people simply use the quasispecies as a synonym for genetic diversity. However, genetic diversity is not the same as the quasispecies! • • The quasispecies works in theory, in “digital organisms” and perhaps in some laboratory populations where mutation rates are increased artificially (i.e. when RNA viruses are about to breech the “error threshold”). However, quasispecies do not occur in laboratory populations with ‘normal’ error rates. • • No good evidence as yet that RNA viruses in nature form quasispecies: • - no evidence that selection acts on the whole population • - mutation rates are too low • • The mutation rate required for the survival of the flattest (> 2 per genome replication) is higher than that seen in nature (< 1 per genome replication)…this only occurs during the treatment of viral infections with mutagens (“lethal mutagenesis”).
Shameless Self-Publicity • Amazon.com Sales Rank: # 666,415 in Books
Estimating Genetic Distance SIVcpz ATGGGTGCGA GAGCGTCAGT TCTAACAGGG GGAAAATTAG ATCGCTGGGA HIV-1 ATGGGTGCGA GAGCGTCAGT ATTAAGCGGG GGAGAATTAG ATCGATGGGA SIVcpz AAAAGTTCGG CTTAGGCCCG GGGGAAGAAA AAGATATATG ATGAAACATT HIV-1 AAAAATTCGG TTAAGGCCAG GGGGAAAGAA AAAATATAAATTAAAACATA SIVcpz TAGTATGGGC AAGCAGGGAG CTGGAAAGAT TCGCATGTGA CCCCGGGCTA HIV-1 TAGTATGGGC AAGCAGGGAG CTAGAACGAT TCGCAGTTAA TCCTGGCCTG SIVcpz ATGGAAAGTA AGGAAGGATG TACTAAATTG TTACAACAAT TAGAGCCAGC HIV-1 TTAGAAACATCAGAAGGCTG TAGACAAATACTGGGACAGC TACAACCATC SIVcpz TCTCAAAACA GGCTCAGAAG GACTGCGGTC CTTGTTTAAC ACTCTGGCAG HIV-1 CCTTCAGACA GGATCAGAAG AACTTAGATC ATTATATAAT ACAGTAGCAA SIVcpz TACTGTGGTG CATACATAGT GACATCACTG TAGAAGACAC ACAGAAAGCT HIV-1 CCCTCTATTG TGTGCATCAAAGGATAGAGA TAAAAGACAC CAAGGAAGCT SIVcpz CTAGAACAGC TAAAGCGGCA TCATGGAGAA CAACAGAGCA AAACTGAAAG HIV-1 TTAGACAAGA TAGAG--GAA -----GAGCA AAACAAAAGT AA---GAAAA SIVcpz TAACTCAGGA AGCCGTGAAG GGGGAGCCAG TCAAGGCGCT AGTGCCTCTG HIV-1 AAGCACAGCA AGC-----AG CAGCTGACA--CAGGACAC- AG--CAGC-- SIVcpz CTGGCATTAG TGGAAATTAC HIV-1 CAGG--TCAG CCAAAATTAC
Multiple Substitutions at a Single Site - Hidden Information Example 1 A T A Only count 1 mutation when 2 have occurred Example 2 A A C T Count 0 mutations when 3 have occurred C
The Problem of Multiple Substitution Actual Observed Hidden information 75 % Divergence 50 25 Time • When % divergence is low, observed distance (p) is a good estimator of genetic distance (d) • When % divergence is high, p underestimates d and a “correction statistic” is required i.e. a model of DNA substitution
Models of DNA Substitution • Models of DNA sequence evolution are required to recover the missing information through correcting for multiple substitutions. The probability of substitution between bases (e.g. A to C, C to T…) ii. The probability of substitution along a sequence (different sites/regions evolve at different rates)
Models of DNA Substitution 1 (Jukes-Cantor, 1969) • Assumptions: i. All bases evolve independently ii. All bases are at equal frequency iii. Each base can change with equal probability () iv. Mutations arise according to a Poisson distribution (rare and independent events) • From this the number of substitutions per site (d) can be estimated by; d = -3/4 In (1-4/3P) where P is the proportion of observed nucleotide differences between 2 sequences.
A C a a a a a T G a All substitutions occur at the same rate (a) Is this model too simple for real data?
A C b a b b a T G b Transitions (a) and transversions (b) occur at a different rate
Models of DNA Substitution 2(Kimura 2-parameter, 1980) • Assumptions: i. All bases evolve independently ii. All bases are at equal frequency iii. Transitions and transversions occur with different probabilities ( and ) iv. The Jukes-Cantor model is applied to transitions and transversions independently • From this the expected number of substitutions per site (d) can be estimated by; d = -1/2 In (1-2P-Q)√1-2Q where P is the proportion of observed transitions and Q the proportion of observed transversions between 2 sequences
Models of DNA Substitution 1. Base frequencies are equal and all substitutions are equally likely (Jukes-Cantor) Simplest (few parameters) 2. Base frequencies are equal but transitions and transversions occur at different rates (Kimura 2-parameter) 3. Unequal base frequencies and transitions and transversions occur at different rates (Hasegawa-Kishino-Yano) 4. Unequal base frequencies and all substitution types occur at different rates (General Reversible Model) Most complex (many parameters) All these models can be tested using the program jMODELTEST (darwin.uvigo.es/software/jmodeltest.html)
Models of DNA Substitution The probability of substitution between bases (e.g. A to C, C to T…) ii. The probability of substitution along a sequence (different sites/regions evolve at different rates)
Frequent among-site rate variation Little among-site rate variation A Gamma Distribution Can be Used to Model Among-Site Rate Heterogeneity
Estimates of a Shape Parameter of Among Site Rate Variation Gene a Prolactin 1.37 Albumin 1.05 C-myc0.47 Ctyochromeb (mtDNA) 0.44 Insulin 0.40 D-loop (mtDNA) 0.17 12S rRNA (mtDNA) 0.16 • Viruses are usually characterized by extensive among-site rate variation (a < 1).
Estimating Genetic Distance: SIVcpz vsHIVlai • Uncorrected (p-distance) = 0.406 • Jukes-Cantor = 0.586 • Kimura 2-parameter = 0.602 • Hasegawa-Kishino-Yano = 0.611 • General reversible = 0.620 • General reversible + gamma = 1.017
Other Models • Allowing a different rate of nucleotide substitution for each codon position in a coding sequence (SRD06; tends to work better than gamma distributions in RNA viruses) • Allowing different sets of nucleotides to change along different lineages (“covarion” model) e.g. sites that are variable in bacteria might be conserved in eukaryotes • Accounting for the non-independence of nucleotides (caused by protein and RNA secondary structures)
Important Problems in Molecular Phylogenetic Analysis • Is there a tree at all (e.g. recombination)? • Many possible trees: - For 10 taxa there are 2 x 10⁶ unrooted trees - For 50 taxa there are 3 x 1074 unrooted trees - efficient and powerful search algorithms • Choosing the right model of nucleotide substitution • Rate variation among lineages (causes “long branch attraction”). Need a representative sample of taxa.
Why Having a Representative Sample of Taxa is Important small tree large tree long branches drawn together long branches far apart (convergent sites pull branches together) (convergent sites distributed across tree) Long branch attraction = convergent site = informative site
Tree-Building Methods No explicit model of sequence evolution Explicit model of sequence evolution pairwise comparison of sequences Statistical approach Application of the parsimony principle maximum likelihood and bayesian parsimony distance
Methods for Inferring Phylogenetic Trees • Parsimony (PAUP*) Find tree with the minimum number of mutations between sequences (i.e. choose tree with the least convergent evolution) • Neighbor-Joining (PAUP*, MEGA) Estimate genetic distances between sequences and cluster these distances into a tree that minimises genetic distance over the whole tree • Maximum Likelihood (PAUP*, GARLi, PhyML, RaxML, MEGA) Determine the probability of a tree (and branch lengths) given a particular model of molecular evolution and the observed sequence data • Bayesian (BEAST, Mr.Bayes) Similar to likelihood but where there is information about the prior distribution of parameters. Also returns a (posterior) distribution of trees
Distance Methods • Advantages: • Allows the use of an explicit model of evolution • Very fast • Simple • Disadvantages: • Only produces one tree with no indication of its quality • Reduces all sequence information into a single distance value • Dependent on the evolutionary model used (preferentially this model should be estimated from the data)
Optimality Methods • Parsimony • Fast • Not statistically consistent with most models of evolution • “The” method for morphological data • Maximum Likelihood • Requires explicit statement of evolutionary model • Slow • Statistically consistent • Most commonly used with molecular data
Maximum Likelihood in Phylogenetics • Best described by Joe Felsenstein • Felsenstein, J. (1981). Evolutionary trees from DNA sequences: a maximum likelihood approach. J. Mol. Evol.17, 368-376 • Now considered the most statistically valid approach to molecular phylogenetics along with the closely related Bayesian methods • Allows us to incorporate extremely detailed models of molecular evolution
Likelihood • Likelihood is a quantity proportional to the probability of observing an outcome/data/event X given a hypothesis H • P ( X | H ) or P ( X | p ) • then we would talk about the likelihood • L ( p | X ) • that is, the likelihood of the parameters given the data. • In this case the hypothesis is a tree + branch lengths and the data are the sequences R.A. Fisher (looking suitably grumpy) Assumes an explicit model of molecular evolution, such as those described previously
Bayesian Phylogenetics • Using Bayesian statistics, you search for a set of plausible trees instead of a single best tree • In this method, the “space” that you search in is limited by prior information • The posteriordistribution of trees can be translated to a probability of any branching event • Allows estimate of uncertainty! • BUT incorporates prior beliefs Andrew Rambaut will explain in more detail…
Searching Through Tree Space • There are two ways in which we can search through tree space to find the best tree for our data: • Branch-and-bound: finds the optimal tree by implicitly checking all possible trees (cutting of paths in the search tree that cannot possibly lead to optimal trees) • Heuristic: searches by randomly perturbing the tree, does not check all trees and cannot guarantee to find the optimal one(s). Most commonly used. • (exhaustive searching is only possible for very small data sets)
Global Maximum Likelihood tree Heuristic searching local optimum Likelihood Starting tree of the heuristic search Trees Starting tree of the heuristic search
Bootstrapping (How Robust is a Tree?) Non-Parametric Bootstrap • Statistical technique that uses random resampling of data to determine sampling error. • Characters are resampled with replacement to create many replicate data sets. A tree is then inferred from each replicate. • Agreement among the resulting trees is summarized with a consensus tree. The frequencies of occurrence of groups, bootstrap proportions, are a measure of support for those groups Parametric Bootstrap (Monte Carlo simulation) • Compare the likelihoods of competing trees on the data. • Simulate replicate sequences using the parameters (including the tree) obtained for the worse tree (null hypothesis). • Compare the likelihoods trees for each replicate data set as before to create a null distribution.
Non-Parametric Bootstrapping 1 23 4 5 6 A AA A A A C CC T T T C CC C C G T TT T T G G GA A A A G GC T T A 1 23 4 5 6 G GA A A A G GA A A A G GC T T A A AA A A A T TT T T G C CC T T T 1 ... Resample with replacement multiple times 1 2 3 4 5 6 1 23 4 5 6 T TT T T G G GC T T A C CC C C G C CC C C G A AA A A A G GA A A A 1000
Recombination & Reassortment • The Problems: - Generates new genetic configurations - Complicates our attempts to infer phylogenetic history and other evolutionary processes (e.g. positive selection) • The Solutions: - Find recombinants and remove them from the data set (usual plan) - Incorporate recombinants into an explicit evolutionary model (far harder) • “Topological incongruence”, where different gene regions (or genes) produce different phylogenetic trees, is the strongest signal for recombination (although conservative)
Methods for Recombination Detection • • Measure level of linkage disequilibrium: • - LDhat, D’ • • Look for changes in patterns of sequence similarity (often pairwise): • - GENECOV, RDP, Max Chi-Square, SimPlot, SiScan, TOPAL • • Look for incongruent phylogenetic trees: • BOOTSCAN, 3SEQ, LARD, PLATO, LIKEWIND • • Look for “networked” evolution • - SplitsTree, NeighborNet • • Look for excessive convergent evolution: • - Homoplasy test, PIST • See http://www.bioinf.manchester.ac.uk/recombination/programs.shtml for a more complete list • Many of these methods are available in the Recombination Detection Program (RDP3) – http://darwin.uvigo.es/rdp/rdp.html
Sliding Window Diversity Plots can Graphically Show Recombination(e.g. “SimPlot”) Hepatitis B virus • Magiorkinis et al. Gene 349, 165-171 (2005).
Detecting Recombination: Looking for Incongruent Trees Maximum likelihood break-point • Programme “LARD” (a maximum likelihood approach) • Compute likelihood of each possible breakpoint in the alignment • Identify breakpoint with the highest likelihood in the alignment • Compare recombination likelihood to that with no recombination • Assess significance with Monte Carlo simulation • Different genes produce different trees A Gene region 2 B Gene region 1 C Although reassortment is commonplace in influenza virus, the occurrence of homologous recombination is highly controversial
Ways of Measuring Selection Pressures (Especially Detecting Positive Selection) • Phylogenetic methods: Identify cases of strong parallel or convergent evolution • Population genetic methods: Look for regional reductions in genetic diversity, usually using SNPs (commonly used with genomic data) Compare estimates of effective population size obtained using different measures of genetic diversity (e.g. the H statistic of Fay & Wu) Estimate the speed of allele fixation compared to neutrality • Combined phylogenetic and population genetic methods: Compare the relative numbers of nonsynonymous (dN) and synonymous (dN) substitutions per site
Detecting Positive Selection by Examining Patterns/Rates of Fixation • Bhatt S, Holmes EC & Pybus OG. (2011). The genomic rate of molecular adaptation of the human influenza A virus. Mol.Biol.Evol. 28, 2443-2451.