Download
1 / 37
370 likes | 526 Vues
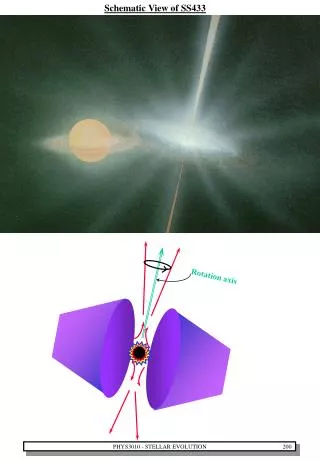
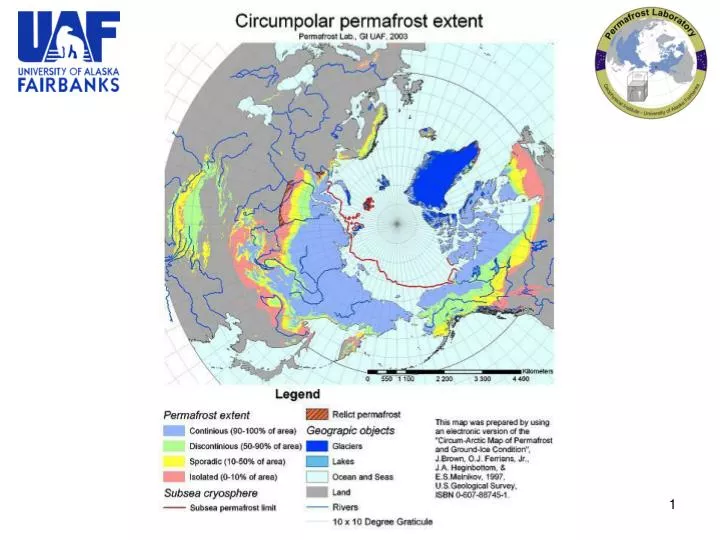
Schematic models of Coastal and Submarine Permafrost distribution under different climatic conditions (after N. Romanovskii). CO 2 and CH 4 in ice cores from Greenland and Antarctica. interglacial. glacial. 400,000 years ago. present. Time. Late-Holocene Permafrost History.

E N D
Schematic models of Coastal and Submarine Permafrost distribution under different climatic conditions (after N. Romanovskii)
CO2 andCH4 in ice cores from Greenland and Antarctica interglacial glacial 400,000 years ago present Time
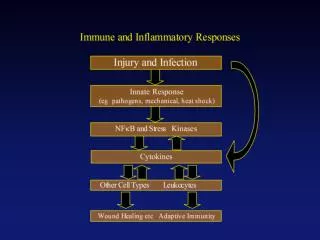
Late-Holocene Permafrost History • Air temperatures were cooling down • New “Holocene” permafrost was formed and southern boundary of permafrost moved far south • New ice wedges started to grow in cold enough places • Vegetation zones moved back south
Mean Annual Ground Temperature MAGT Permafrost Characteristics Mean Annual Ground Temperature
Holocene Optimum: 6-5 ka ago Late Wisconsin: 30-20 ka ago
Mann et al., 1999, Northern Hemisphere Millennial Temperature Reconstruction.
Projected surface air temperature(2090-2099 relative to 1980-1999) IPCC, 2007; Figure SPM6
Arctic Ocean Alaska Siberia 80 E 160 E 120 E 140 E 100 E Distribution of Ice-Rich Yedoma (Ice Complex) Deposits in East Siberia Map based on Romanovskii, 1959 • - Thickness of the deposit is between 5-100m • Present day total coverage is > 1x10⁶ km • Gravimetric ground ice contents in the sediments between 60-120% • Including the ice wedges, total volumetric ice content of up to >75% • Organic carbon content averages between 2-5% • Accumulation during several 10 000 years Zimov et al 2006 (Science), Schirrmeister et al., 2008
The form and distribution of wind-blown silt(loess), wind-blown sand (dunes), and other deposits of wind-blown sediment in Alaska(Compiled from multiple sources by Muhs and Budahn, 2006)
Data from I. Semiletov, Summer 2004 Joint Russia – USA Cruise (Far Eastern Branch of the Russian Academy of Sciences and International Arctic Research Center, UAF) Distribution of dissolved methane in the area near to the Bolshoi Lakhovsky Island demonstrates an extremely high concentration of CH4 from the bottom to the top of the water column (up to 120 nmol/l). This can be an indication of active methane ebullition from the sea floor.
The seabed of the East Siberian Arctic Shelf serves as a source of methane to the water column Distribution of methane in the bottom layer (2003-2007) Shakhova and Semiletov, 2008
Most of the methane survives oxidation within the water column and reaches the surface layer. Distribution of methane in the surface layer (2003-2007) Shakhova and Semiletov, 2008