Download
1 / 35
400 likes | 712 Vues
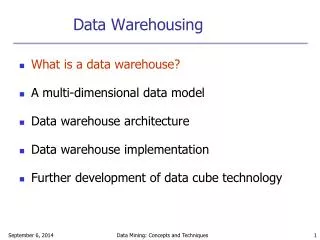
Data Warehousing Lifecycle. Conceptual modeling: System requirements, data sources and warehousing activities. Logical design: Data flow from sources to DW, composition and semantics of activities. Application development: DW interfaces, OLAP

E N D
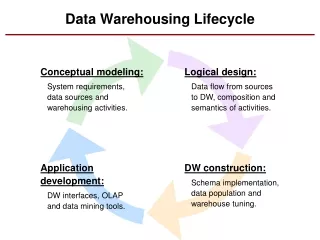
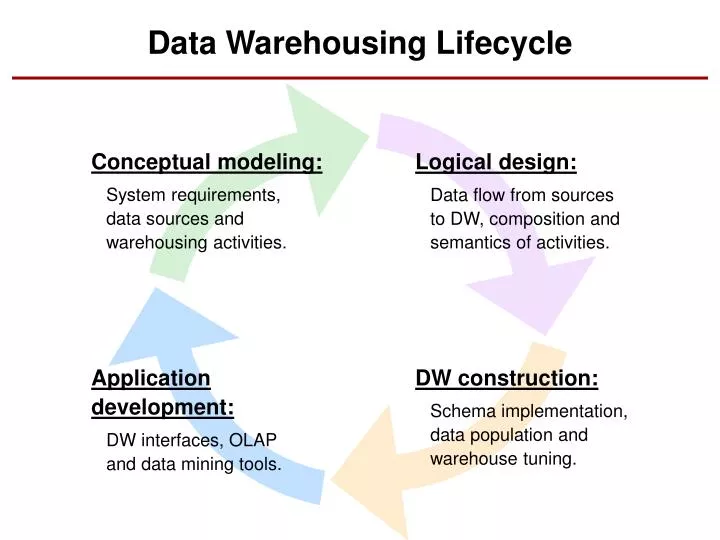
Data Warehousing Lifecycle Conceptual modeling: System requirements, data sources and warehousing activities. Logical design: Data flow from sources to DW, composition and semantics of activities. Application development: DW interfaces, OLAP and data mining tools. DW construction: Schema implementation, data population and warehouse tuning.
Biomediacl Data Warehouse System Architecture Data Sources Data Integration Data Warehouse Unified Access Data Mining Clinical data and sample annotations • Ad hoc • queries • OLAP • Cluster • analysis • Mining gene • regulatory • networks • Interactome • prediction • Pathway • analysis Gene functional annotations Data extraction, trans- formation, cleaning & loading Metadata capturing & integration Data quality control Refreshment A standard interface for application tools Object-oriented Defining basic operators for data access Microarray mRNA expression Proteomics protein expression Promoter sequences and motifs Protein domains & interactome
On-Line Analytical Processing (OLAP) roll-up to brand roll-up to region NY NY Store Store SF SF LA LA 10 15 18 5 24 32 16 120 Juice Milk Coke Cream Soap Bread Juice Milk Coke Cream Soap Bread Product Product roll-up to week M T W Th F S S W1 2 3 4 Time (day) Time (week) Dimensions:Time, Product, Store Hierarchies:Day Week Quarter Product Brand … Store Region Country Operators:roll-up, drill-down, slice and dice. Uses: Business data analysis, e.g., market-driven trend analysis.
Logical Data Modeling: A Star Schema Example Time time_key day month year Branch branch_key name type 1 1 Sales time_key branch_key location_key product_key num_units amount_usd n n n ??? n Location location_key city state country Product product_key name brand type 1 1 Supplier supplier_key name type • One-to-many relationships between the fact and dimensions. • The fact-dimension relationships are certain. • Dimensions in star models are often tightly coupled. • Star schema does not appear to be very extensible.
Biomedical Data Resources • Static data: data on genotypes, biological entities such as nucleic acids, protein and relationships between these entities. • Dynamic data: data on phenotypes, the dynamics of biological processes. • Data on analysis tools: data on biological and computer science methods which can be used to identify the entities and relationships. • References and annotations: to scientific papers and textual explanations.
Biomedical Data Modeling • Flat file collections: Databases were built up as indexed ASCII text files. • Relational databases: many biology databases were implemented using Oracle, Sybase, or MySQL. • Object-oriented databases: data are modeled as objects that are organized in classes. • Multidimensional databases: data are organized in star like schema.
Using Star Schema in Gene Expression Data Management • “Applying Data Warehouse Concepts to Gene Expression Data Management”, by V. Markowitz and T. Topaloglou • Three modeling data spaces: • Sample data space • Gene Annotation data space • Gene expression data space
Gene Expression Data Space Experiment Gene Experiment_id Exp_name Exp_date Exp_file Sample Gene_id Gene_name Gene_symbol Expression Gene_id Experiment_id Analysis_id Expression_call Analysis Analysis_id Algorithm version Clinical Sample
Sample Data Space Donor Demorgraphics Donor Clinical Donor Biological Sample Study Pathways
Gene Annotation Data Space Known gene Microarray Design Sequence Cluster Gene Fragments Sequence Chromosome Pathways
OLAP Operations • Sample selection: extract sets of samples with a certain profile on the sample data space. Eg, a sample set of male colon samples with adenocarcenoma for donors in the age group 40-60. • Classification on organ: total number of samples classified by liver, brain, …
OLAP Operations • Gene selection: extract sets of genes with certain properties over the gene annotation data space. Eg, a gene set of the genes on chromosome 22 … • Aggregates: gene summarization on sample dimension, sample summarization on gene dimension. Etc.
Clinical Data Sapce Disease n n n Demographics Clinical Test 1 n n n 1 1 n Patient Followup Medical Image n 1 n n n Drug Physiology n Clinical Sample
Sample Data Sapce Patient 1 Anatomy Ontology Biochemical Assay n n n n n Clinical Sample n 1 1 n n mRNA Expression Genetic Screening n Protein Expression
Microarray Data Sapce Gene Sequence 1 n 1 1 Array Probe Clinical Sample n n mRNA Expression n n 1 1 Measurement Unit Experiment
Proteomic Data Sapce 1 1 Gene Sequence Clinical Sample n n Protein Expression n n 1 1 Measurement Unit Experiment
Experiment Data Sapce 1 1 Project Protocol n n 1 n n 1 Experiment Person Platform n n 1 1 Normalization Publication
Gene Data Sapce mRNA Expression n Protein Expression 1 n Array Probe n 1 1 1 2 n n Protein-Protein Interaction Gene Cluster Gene Sequence n n 1 n n n Promoter Gene Ontology Protein Domain
Explicit Definition of Concept Hierarchies Disease Gene Ontology Gene Cluster n n n n n n Patient Anatomy Ontology Gene Sequence 1 1 1 n n n 1 1 Array Probe Clinical Sample n n mRNA Expression n n 1 1 Measurement Unit Experiment n n n 1 1 Project Platform 1 Normalization
Large Number of Dimensions and Evolution of Dimensions • If Star schema is used and the number of dimensions is large, the fact table will be huge (combination of foreign keys). • Adding new dimension to Star schema will require re-computing of all data entries in the fact table.
Many-to-Many relationships • The many-to-many relationships cannot be easily modeled using Star schema, which is originally designed to handle many-to-one relationships between business fact and a dimension.
Incompleteness of Data • Clinical data may be incomplete. This may cause a lot of null values in the fact table for foreign keys, which will result in inconsistency.
Star Schema Dim1 DimKey1 . . . Dim2 DimKey2 . . . Fact DimKey1 DimKey2 DimKey3 DimKey4 Measure1 Measure2 Measure3 Measure4 Dim3 DimKey3 . . . Dim4 DimKey4 . . . BioStar Schema MTable1 DimKey1 FactKey Measure1 Dim1 DimKey1 . . . MTable2 DimKey2 FactKey Measure2 Dim2 DimKey2 . . . Fact FactKey . . . Dim3 DimKey3 . . . MTable3 DimKey3 FactKey Measure3 MTable4 DimKey4 FactKey Measure4 Dim4 DimKey4 . . .
BioStar Schema for Part of the Clinical Data Space TestResult TestID PatientID Result DateTested ClinicalTest TestID TestName TestType TestSetting Diagnosis DiseaseID PatientID Symptom ValidFrom ValidTo Disease DiseaseID Name Type Description Patient PatientID SSN Name Gender DOB DrugUse DrugID PatientID Dosage ValidFrom ValidTo ClinicalSample SampleID PatientID Source Amount DateTaken Drug DrugID DrugName DrugType Description Extensibility and flexibility
BioStar Schema for the Sample Data Space GeneticScreen MarkerID SampleID Result RawData Comment DateTested SampleAnatomy TermID SampleID Description AnatomyTerm TermID TermType TermName Definition GeneticMarker MarkerID MarkerName MarkerType GeneticLocus Description ClinicalSample SampleID PatientID Source Amount DateTaken BiochemAssay AssayID AssayName AssayType AssaySetting Description mRNAExpression SampleID ArrayProbeID ExperimentID MeasureUnitID Expression AssayResult AssayID SampleID Result Comment DateTested
BioStar Schema for Part of the Gene Data Space GOTerm GOID Accession TermType TermName Definition GOAnnotation GOID UID Evidence ArrayProbe ArrayProbeID UID ArrayID ProbeName Description IsQC Cluster ClusterID NumOfGenes ExprPattern ClusteringTool ToolSetting Description GeneCluster ClusterID UID Promoter PromoterID UID PromoterType PromoterSeq Length Description GeneSequence UID SeqType Accession Version SeqDataset SpeciesID Status GeneDomain DomainID UID Alignment SeqFrom SeqTo DomainFrom DomainTo EValue BitScore ProteinInteract UID1 UID2 Evidence Description DomainModel DomainID ModelType SourceDB Accession Title Length Description
Star Schema for the Microarray Data Space ArrayProbe ArrayProbeID UID ArrayID ProbeName Description IsQC GeneSequence UID SeqType Accession Version SeqDataset SpeciesID Status ClinicalSample SampleID PatientID Source Amount DateTaken mRNAExpression SampleID ArrayProbeID ExperimentID MeasureUnitID Expression Experiment ExperimentID ExperimentName ExperimentType ProjectID PersonID PlatformID ProtocolID NormalizationID PublicationID MeasurementUnit MeasureUnitID MeasureUnitName MeasureUnitType Description
Star Schema for the Proteomic Data Space GeneSequence UID SeqType Accession Version SeqDataset SpeciesID Status ClinicalSample SampleID PatientID Source Amount DateTaken ProteinExpression SampleID UID ExperimentID MeasureUnitID Expression Experiment ExperimentID ExperimentName ExperimentType ProjectID PersonID PlatformID ProtocolID NormalizationID PublicationID MeasurementUnit MeasureUnitID MeasureUnitName MeasureUnitType Description
Star Schema for the Experiment Data Space Project ProjectID ProjectName Investigator Description Person PersonID PersonName LabName Contact Experiment ExperimentID ExperimentName ExperimentType ProjectID PersonID PlatformID ProtocolID NormalizationID PublicationID Protocol ProtocolID ProtocolName ProtocolText CreatedBy Platform PlatformID Hardware Software Settings Description Publication PublicationID PubMedID Title Authors Abstract PubDate Citation Normalization NormalizationID NormType Software Parameters Description
BioStar is not Fact Constellation • You may view measure tables as small “fact” tables, but fact tables in a constellation usually share multiple dimension tables. Dimension table Dimension table Dimension table Fact table Fact table Dimension table Dimension table Fact table Dimension table Dimension table Dimension table
Extensibility of BioStar • Add a protein structure information dimension to gene data space. ProteinSequence ProteinStructure GeneSequence UID SeqType Accession Version SeqDataset SpeciesID Status UID PDBID ….. PDBID ….. Measure table Dimension table Populating the two new tables will not affect other tables.
Flexibility of BioStar • Separate tables for fact measures to solve the many-to-many relationship problem dimension table and its associated measure table can be populated independently avoid null values.
Sample Classification Hierarchy All_sample Normal Tumor . . . Adeno- carcinoma CNS_tumor Leukemia . . . Brain Blood Colon Breast . . . . . . Glio- blastoma Colon tumor Breast tumor ALL AML . . . . . . . . . . . . . . .. . . . . . . . . . . . . . . . . . . . . (Patients)
OLAP for Microarray Data Exploration Dimensions: Sample Gene Measurement Unit Operators: roll-up drill-down slice dice t-test p-select Application: Exploration of gene expression data roll-up to GO terms roll-up to expression Measurement Unit PA Val D13626 D13627 D13628 J04605 L37042 S78653 X60003 Z11518 10 15 18 5 24 32 16 Gene roll-up to disease types 1 2 3 4 5 6 7 Sample (patient)