Download
1 / 43
430 likes | 617 Vues
THE CHESAPEAKE BAY TMDL: Restoring Waters of New York and the Chesapeake Bay. Bay TMDL Public Meeting December 1, 2009 Binghamton, New York Katherine Antos and Bob Koroncai U.S. EPA Region III. 1. Click the double arrow to show or hide your control panel. Type your questions here.

E N D
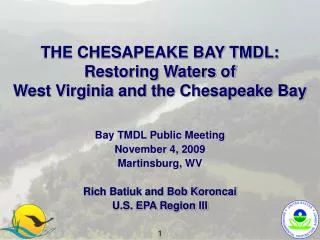
THE CHESAPEAKE BAY TMDL: Restoring Waters of New York and the Chesapeake Bay Bay TMDL Public Meeting December 1, 2009 Binghamton, New York Katherine Antos and Bob Koroncai U.S. EPA Region III 1
Click the double arrow to show or hide your control panel • Type your questions here. (Indicate organization) Note: Because of the large audience, not all questions will be answered, but they will be saved, and your questions will help drive future events and could contribute to a FAQ. 2
Technical Issues? Contact: Citrix Global Customer Support 1-800-263-6317 3
AGENDA Welcome, introductions, and meeting logistics – Peter Freehafer, NYSDEC(5 minutes) EPA presentation on the Chesapeake Bay TMDL and EPA expectations – Katherine Antos and Bob Koroncai, EPA (45 minutes) Next Steps – Ron Entringer, NYSDEC(20 minutes) Presentations from Local Government & Watershed Groups – Carol Sweeney, Town of Owego (10 minutes) Jim Curatolo, Upper Susquehanna Coalition (10 minutes) Public comments, questions and answers – Panel moderated by Peter Freehafer(60 minutes) Adjourn 4
Panel to Address Public Comments Moderator: Peter Freehafer, NYSDEC EPA: Katherine Antos and Bob Koroncai NYSDEC: Peter Freehafer and Ron Entringer Town of Owego: Carol Sweeney Upper Susquehanna Coalition: Jim Curatolo Madison Co. SWCD: Steve Lorraine Binghamton-Johnson City WWTP Superintendent: Catherine Aingworth 5
Environmental Protection AgencyBay-related Organizational Structure
Susquehanna, Chenango and Unadilla River main stem impairment is fish consumption from mercury from atmospheric deposition 2009 Final Draft, http://www.dec.ny.gov/chemical/36734.html
Nutrient Impaired Waters New York Susquehanna and Chemung River Basins 2008 303(d) List, http://www.dec.ny.gov/chemical/31290.html
Tioga River, Steuben County Photo credit: Upper Susquehanna Coalition
Chesapeake Bay Watershed-By the Numbers • Largest U.S. estuary • Six-states and DC, 64,000 square mile watershed • 10,000 miles of shoreline (longer then entire U.S. west coast) • Over 3,600 species of plants, fish and other animals • Average depth: 21 feet • $750 million contribution annually to local economies • Home to 17 million people (and counting) • 77,000 principally family farms • Declared “national treasure” by President Obama 16 Source: www.chesapeakebay.net
Nutrient Loads by State Nitrogen* Phosphorus *EPA estimates a nitrogen load of 284 million lbs nitrogen in 2008. EPA assumes a reduction of 7 million lbs due to the Clean Air Act. This leaves 77 millions lbs to be addressed through the TMDL process. 17
Nutrient Sources of NY Sources of Phosphorus from New York Sources of Nitrogen from New York N and P values from 2008 Scenario of Phase 5.2 Watershed Model 18
Chesapeake Bay Health- Past and Future 19
Restored Bay Summary: 2008 Bay Health Assessment Priority Areas Water Quality 21% of Goals Achieved Habitats & Lower Food Web 45% of Goals Achieved Not quantified in relation to a goal Fish &Shellfish 48% of Goals Achieved Not quantified in relation to a goal Data and Methods: www.chesapeakebay.net/status_bayhealth.aspx 20
The Chesapeake Bay TMDL • EPA sets pollution diet to meet states’ Bay clean water standards • Caps on nitrogen, phosphorus and sediment loads for all 6 Bay watershed states and DC • States set load caps for point and non-point sources 22
The Bay science supports local pollution diets… Phase 4 Bay Watershed Model (2000-2008) Phase 5 Bay Watershed Model (2009- ) 23
Taking Responsibility for Load Reductions Identify basinwide target loads EPA, States, DC Identify major basin by jurisdiction target loads EPA, States, DC Identify tidal segment watershed, county and source sector target loads States, DC, local governments & local partners 25
What are the Target Pollutant Cap Loads for the Bay Watershed? Current model estimates are that the states’ Bay water quality standards can be met at basinwide loading levels of: - 200 million pounds nitrogen per year - 15 million pounds phosphorus per year (Sediment target cap load under development-will be available by spring 2010) 26
Dividing the Basinwide Target Loading 27
Guidelines for Distributing the Basinwide Target Loads • Water quality and living resource goals should be achieved. • Waters that contribute the most to the problem should achieve the most reductions (on a per pound basis). • All previous reductions in nutrient loads are credited toward achieving final cap loads. 28
Current State Target Loads Nitrogen Phosphorus All loads are in millions of pounds per year. 30
New York’s Past, Present and Future Estimated Loads Nitrogen Phosphorus All scenarios run through Phase 5.2 Watershed Model 31
Target Load Refinements • If States’ Bay Water Quality Standards can still be achieved… • The State may exchange nitrogen and phosphorus target loads within a basin; and/or • The State may exchange nitrogen and phosphorus loads from one basin to another within the State. 32
The Chesapeake Bay Performance and Accountability System 33
Employ Federal Actions or Consequences Monitor Progress Set 2-Year Milestones Mandatory Pollution Diet at Work Develop Watershed Implementation Plans Establish Bay TMDL: 34
Example: Watershed Implementation Plan Elements Propose new legislative authorities Implement regulatory controls Examples of Some Planned Controls Propose increased budget to legislature Increased program budget Increased controls Rulemaking 35 26 Load Reduction Schedule 20 Interim Targets Final Targets Milestones for Assessing Progress Stage 1 Implementation Stage 2 Implementation • Also divide jurisdiction load by 303(d) segment drainage area and, by November 2011, local area • Attain jurisdiction-wide load reductions by the interim target, or justify why can still meet final target • Jurisdiction would determine desired 2-year schedule to meet interim and final target loads • EPA first evaluates milestones based on consistency with jurisdiction target load. EPA accepts shifts among source sectors, basins, segment drainages, and local areas if jurisdiction target load is met and local and Bay water quality goals are achieved
Federal Consequences Directed at states not achieving expectations Will be outlined in an EPA letter this fall. May include: Assigning more stringent pollution reductions to regulated point sources (e.g., wastewater, stormwater, CAFOs) Objecting to state-issued NPDES permits Limiting or prohibiting new or expanded discharges (e.g., wastewater, stormwater) of nutrients and sediment Withholding, conditioning or reallocating federal grant funds 36
Bay TMDL- Presidential Executive Order Connections • Create Federal Leadership Committee • Create the Performance and Accountability Framework • Expand regulatory tools for CAFO’s and urban and suburban runoff • Improve nutrient and sediment controls on federal lands and roads 37
Your Role in Bay TMDL Process Major basin jurisdiction loading targets Local Program Capacity/Gap Evaluation Final TMDL Established December 2010 Oct 2009 Bay TMDL Public Meetings Phase 2 Watershed Implementation Plans: Jan – Nov 2011 Divide Target Loads among Watersheds, Counties, Sources November-December 2009 Phase 1 Watershed Implementation Plans: November 2009 – August 2010 2-year milestones, reporting, modeling, monitoring Starting 2011 Public Review And Comment August-October 2010 38
Bay TMDL: Bottom-line • Actions will clean and protect local waters in NY thereby supporting the local economy • Restore a thriving Chesapeake Bay • Federal, state, local officials and agencies will be fully accountable to the public • Consequences for inaction, lack of progress 39
Further Information • Chesapeake Bay TMDL web site www.epa.gov/chesapeakebaytmdl • U.S. EPA Region 3 Contacts • Water Protection Division • Bob Koroncai • 215-814-5730; koroncai.robert@epa.gov • Jennifer Sincock (sincock.jennifer@epa.gov) • Chesapeake Bay Program Office • Rich Batiuk • 410-267-5731; batiuk.richard@epa.gov • Katherine Antos (antos.katherine@epa.gov) 40
Thank you for your participation. That concludes today’s meeting. 42