Download
1 / 18
200 likes | 240 Vues
Statistics: Descriptive and Inferential. Data is numerical. Statistics. A set of mathematical techniques used by social scientists to organize and manipulate data for the purpose of answering questions and testing theories. Variable. Any trait that can change values from case to case.

E N D
Statistics • A set of mathematical techniques used by social scientists to organize and manipulate data for the purpose of answering questions and testing theories
Variable • Any trait that can change values from case to case
Independent Variable Dependent Variable
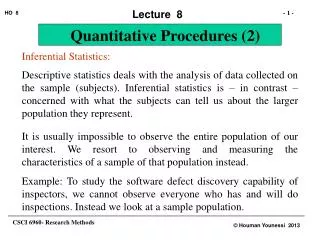
Descriptive Statistics • When the researcher needs to summarize or describe the distribution of a single variable • When the researcher wishes to understand the relationship between two or more variables
Data Reduction • Process of allowing a few numbers to summarize many numbers • Is the basic goal of single-variable (or univariate) descriptive statistical procedures
Measures of Association • Understand the relationship between two or more variables • Allow to quantify the strength and direction of a relationship
Inferential Statistics • Wish to generalize findings from a sample to a population • Population – total collection of all cases that the researcher wishes to understand better • Involves using information from samples (carefully chosen subsets of the defined populations) to make inferences about populations
Discrete Variable • It has a basic unit of measurement that cannot be subdivided • Eg. # of people per household
Continuous Variable • If the measurement can be subdivided infinitely • Eg. time • Always approximating and rounding off the scores • Reported as discrete
Level of Measurement • Nominal • Ordinal • Interval-ratio (I/R)
Nominal • Classification into categories is the only measurement procedure permitted • Not numerical • Compared to each other only in terms of the number of cases classified in them
Nominal • Categories not higher or lower along some numerical scale • Eg. gender, religious affiliation • Mutually exclusive and exhaustive • Categories are relatively homogeneous
Ordinal • Classify into categories • Allow categories to be ranked • High to low, more or less than another • Eg. SES: upper class, middle class, working class, lower class
Ordinal • Represents only a position • The distance between the scores cannot be described in precise terms • Averages cannot be used
Interval-Ratio (I/R) • They are measured in units that have equal intevals • Eg. age, # of siblings • Have a true zero • Zero indicates the absence or complete lack of whatever is being measured • Eg. education, income
Levels of measurement is the first guideline to use in selecting a statistic