Download

1 / 21
210 likes | 400 Vues
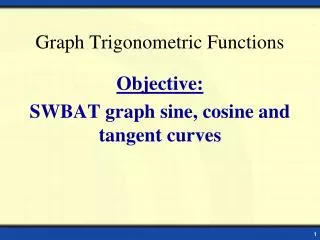
Objectives. Graph functions given a limited domain. Graph functions given a domain of all real numbers. Scientists can use a function to make conclusions about the rising sea level.

E N D
Objectives Graph functions given a limited domain. Graph functions given a domain of all real numbers.
Scientists can use a function to make conclusions about the rising sea level. Sea level is rising at an approximate rate of 2.5 millimeters per year. If this rate continues, the function y = 2.5x can describe how many millimeters y sea level will rise in the next x years. One way to understand functions such as the one above is to graph them. You can graph a function by finding ordered pairs that satisfy the function.
–x –x Example 1A: Graphing Solutions Given a Domain Graph the function for the given domain. x –3y = –6; D: {–3, 0, 3, 6} Step 1 Solve for y since you are given values of the domain, or x. x –3y = –6 Subtract x from both sides. –3y = –x – 6 Since y is multiplied by –3, divide both sides by –3. Simplify.
Example 1A Continued Graph the function for the given domain. Step 2 Substitute the given value of the domain for xand find values of y. (x, y) x –3 (–3, 1) 0 (0, 2) 3 (3, 3) (6, 4) 6
y • • • • x Example 1A Continued Graph the function for the given domain. Step 3 Graph the ordered pairs.
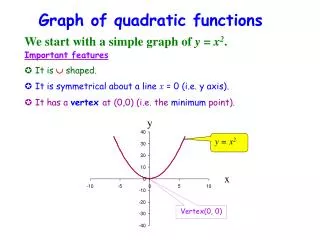
(x, f(x)) f(x) = x2–3 x –2 (–2, 1) f(x) = (–2)2–3 = 1 –1 (–1, –2) f(x) = (–1)2–3 = –2 f(x) = 02 –3 = –3 (0, –3) 0 f(x) = 12–3 = –2 (1, –2) 1 f(x) = 22–3 = 1 2 (2, 1) Example 1B: Graphing Solutions Given a Domain Graph the function for the given domain. f(x) = x2 – 3; D: {–2, –1, 0, 1, 2} Step 1 Use the given values of the domain to find values of f(x).
y x • • • • • Example 1B Continued Graph the function for the given domain. f(x) = x2 – 3; D: {–2, –1, 0, 1, 2} Step 2 Graph the ordered pairs.
+2x +2x Check It Out! Example 1a Graph the function for the given domain. –2x + y = 3; D: {–5, –3, 1, 4} Step 1 Solve for y since you are given values of the domain, or x. –2x + y = 3 Add 2x to both sides. y = 2x + 3
–5 y= 2(–5) + 3 = –7 (–5, –7) (–3, –3) –3 y= 2(–3) + 3 = –3 (1, 5) 1 y= 2(1) + 3 = 5 4 y= 2(4) + 3 = 11 (4, 11) Check It Out! Example 1a Continued Graph the function for the given domain. –2x + y = 3; D: {–5, –3, 1, 4} Step 2 Substitute the given values of the domain for xand find values of y. (x, y) x y = 2x + 3
Check It Out! Example 1a Continued Graph the function for the given domain. –2x + y = 3; D: {–5, –3, 1, 4} Step 3 Graph the ordered pairs.
f(x) = x2 + 2 x (x, f(x)) (–3, 11) –3 f(x) = (–32) + 2= 11 (–1, 3) –1 f(x) = (–12 ) + 2= 3 f(x) = 02 + 2= 2 0 (0, 2) 1 f(x) = 12 + 2=3 (1, 3) 3 f(x) = 32 + 2=11 (3, 11) Check It Out! Example 1b Graph the function for the given domain. f(x) = x2 + 2; D: {–3, –1, 0, 1, 3} Step 1 Use the given values of the domain to find the values of f(x).
Check It Out! Example 1b Graph the function for the given domain. f(x) = x2 + 2; D: {–3, –1, 0, 1, 3} Step 2 Graph the ordered pairs.
Example 2A: Graphing Functions Graph the function –3x + 2 = y. Step 1 Choose several values of x and generate ordered pairs. (–2, 8) –2 –3(–2) + 2 = 8 (–1, 5) –3(–1) + 2 = 5 –1 (0, 2) 0 –3(0) + 2 = 2 (1, –1) 1 –3(1) + 2 = –1 (2, –4) 2 –3(2) + 2 = –4 (3, –7) 3 –3(3) + 2 = –7
Example 2A Continued Graph the function –3x + 2 = y. Step 2 Plot enough points to see a pattern.
Example 2A Continued Graph the function –3x + 2 = y. Step 3 The ordered pairs appear to form a line. Draw a line through all the points to show all the ordered pairs that satisfy the function. Draw arrowheads on both “ends” of the line.
Example 2B: Graphing Functions Graph the function g(x) = |x| + 2. Step 1 Choose several values of x and generate ordered pairs. g(x) = |–2| + 2= 4 –2 (–2, 4) g(x) = |–1| + 2= 3 (–1, 3) –1 (0, 2) 0 g(x) = |0| + 2= 2 g(x) = |1| + 2= 3 (1, 3) 1 2 g(x) = |2| + 2= 4 (2, 4) (3, 5) 3 g(x) = |3| + 2= 5
Example 2B Continued Graph the function g(x) = |x| + 2. Step 2 Plot enough points to see a pattern.
Check It Out! Example 2a Graph the function f(x) = 3x – 2. Step 1 Choose several values of x and generate ordered pairs. (–2, –8) f(x) = 3(–2) – 2 = –8 –2 (–1, –5) –1 f(x) = 3(–1) – 2 = –5 (0, –2) 0 f(x) = 3(0) – 2 = –2 1 (1, 1) f(x) = 3(1) – 2 = 1 2 (2, 4) f(x) = 3(2) – 2 = 4 (3, 7) 3 f(x) = 3(3) – 2 = 7
Check It Out! Example 2a Continued Graph the function f(x) = 3x – 2. Step 2 Plot enough points to see a pattern.
Check It Out! Example 2b Graph the function y = |x– 1|. Step 1 Choose several values of x and generate ordered pairs. y= |–2– 1| = 3 (–2, 3) –2 –1 y= |–1 – 1| = 2 (–1, 2) (0, 1) 0 y= |0 – 1| = 1 1 (1, 0) y= |1 – 1| = 0 2 y= |2 – 1| = 1 (2, 1)
Check It Out! Example 2b Continued Graph the function y = |x– 1|. Step 2 Plot enough points to see a pattern.