Download
1 / 42
420 likes | 429 Vues
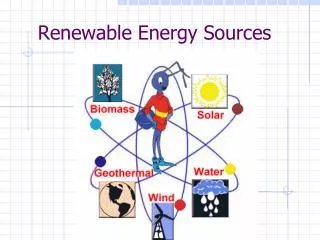
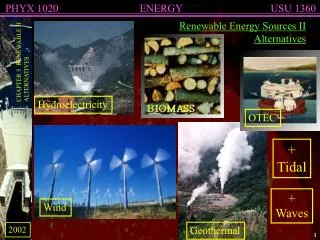
Renewable Energy Sources II. I. Hydroelectric Power. Hydropower accounts for 2.2% of the world’s energy supply, and 16% of the world’s electricity production The world’s top five producers (in kWh) of hydropower are Canada, China, Brazil, the U.S., and Russia

E N D
I. Hydroelectric Power • Hydropower accounts for 2.2% of the world’s energy supply, and 16% of the world’s electricity production • The world’s top five producers (in kWh) of hydropower are Canada, China, Brazil, the U.S., and Russia • 99% of Norway’s power, 75% of New Zealand’s power, and 21% of China’s electricity is produced by hydropower.
I. Hydroelectric Power D. Hydropower has two clear advantages over fossil fuels for producing electricity: • It is renewable: as long as precipitation fills rivers we can use water to turn turbines • It is cleaner than fossil fuels : no carbon dioxide is emitted E. Hydropower is efficient • It has a net energy yield of 10:1, as high as any modern-day energy source
F. Hydropower has negative impacts 1) Damming rivers destroys habitats • Upstream areas are submerged • Downstream areas are starved of water 2) Natural flooding cycles are disrupted, and areas downstream lose silt, nutrient, and water inputs 3) Dams block passage of fish, fragmenting the river and reducing biodiversity
4) Many dams produce methane – when an area of vegetation is submerged, it slowly rots (via anaerobic respiration) and releases methane. This rotting process is very slow – it has been estimated that a large tree in a submerged Amazon reservoir can take up to 500 years to completely decompose, releasing methane the entire time. a) Remember that methane is a very potent greenhouse gas, trapping heat 25 times more effectively than CO2
b) Scientists have estimated that dam reservoirs produce up to 1/5th of all the manmade methane in the atmosphere and make up to 7% of the man-made greenhouse effect. This percentage is greater than aircraft emissions.
5) Dams trap sediment in the river (aka silt) and eventually reservoirs fill with silt and effectively stop electricity generation at a dam. • Worldwide reservoirs are losing capacity due to silt at about 1% of their storage capacity per year. This means that most dams have an effective life of about 100 years. • The Yellow River in China is the world’s siltiest river – dams on this river have a life span of 25-40 years.
6) Evaporation losses from the reservoirs created by dams can be significant – the amount of evaporation depends on the surface area of the reservoir, the climate of the region, and the amount of time the water spends in the reservoir. a) The Aswan Dam and Lake Nasser (second largest man-made lake in the world)in Egypt loses 8 to 12 million acre feet a year, which is a quarter of the water flow into the lake.
G. Hydropower may not expand much more 1) China’s Three Gorges Dam is the world’s largest dam 2) Most of the world’s large rivers have already been dammed 3) People have grown aware of the ecological impact of dams 4) Developing nations will probably increase hydropower if they have rivers
II. Small-Scale Hydroelectric A. Can be developed at a greater variety of sites than traditional hydroelectric, and includes wave and tidal energy B. The motion of wind-driven waves at the ocean’s surface is harnessed and converted from mechanical energy into electricity C. Many designs exist, but few are adequately tested D. Some designs are for offshore facilities and involve floating devices that move up and down the waves • Wave energy is greater at deep ocean sites, but transmitting electricity to shore is very expensive
II. Small-Scale Hydroelectric E. Scientists are devising ways to use kinetic energy from the natural motion of ocean water to generate electrical power F. The rising and falling of ocean tides twice each day throughout the world moves large amounts of water • Differences in height between low and high tides are especially great in long narrow bays • These areas are best for harnessing tidal energy by erecting dams across the outlets of tidal basins
II. Small-Scale Hydroelectric G. Waves are directed into narrow channels and elevated reservoirs; electricity is generated when water flows out H. Another design uses rising and falling waves to push air in and out of chambers, turning turbines to generate electricity • No commercial wave energy facilities are operating I. A third design uses the motion of ocean currents, such as the Gulf Stream • Currently being tested in Europe
III. Wind Energy A. Wind turbines = devices that harness power from wind B. Windmills have been used for 800 years to pump water C. The first windmill to generate electricity was built in the late 1800s D. After the 1973 oil embargo, governments funded research and development E. Today, wind power produces electricity for the same price as conventional sources
F. Modern wind turbines convert kinetic energy 1) Wind blowing into a turbine turns the blades of the rotor, which rotate machinery inside a compartment on top of a tall tower 2) Towers are 40 - 100 m (131 - 328 ft) tall • Higher is better to minimize turbulence and maximize wind speed
G. Wind farms 1) Wind farms = turbines erected in groups of up to hundreds of turbines 2) Turbines harness wind as efficiently as possible • Different turbines turn at different speeds • Slight increases in wind velocity yield significant power output
H. Wind is the fastest-growing energy sector 1) Wind power grew 25% per year globally between 2000 and 2005 • Five nations account for 80% of the world’s wind power 2) California and Texas produce the most wind power in the U.S. • Wind power could be expanded to meet the electrical needs of the entire U.S.
I. Current US wind power generation • 35 gigawatts currently, to get to 20 % of US electricity generated by wind, would need 300GW of power generation • This would require 100,000 additional turbines • Largest wind farm in the world is in Texas! Horse Hollow Energy Center, 740 MW generation. 471 turbines on 47,000 acres of land.
1) Wind speeds are 20% greater over water than over land 2) There is less air turbulence over water than land 3) Costs to erect and maintain turbines in water are higher, but the stronger, less turbulent winds produce more power and make offshore wind more profitable 4) Currently, turbines are limited to shallow water J. Offshore sites can be promising
5) A huge off-shore wind farm is in the works in the North Sea, again as part of the Desertec company. Generation capacity will be 141 Gigawatts! (that would be 10% of US electricity needs)
U.S. wind-generating capacity Wind's capacity to generate power varies according to wind speed
K. Benefits of Wind Power • Minimal Water use • No greenhouse emissions • Not very expensive • Can multi-use land under turbines for farming, grazing, ect.
L. Drawbacks of Wind Power • Intermittent power and no way to store energy for still days • Wildlife mortality – birds and bats However… Bird mortality from turbines represent about 0.1% of all bird deaths
3) Turbines that are too close to radar stations show electronic signatures similar to small planes. This radar issue has delayed or stopped 4,200 megawatts worth of wind power generation. - Both turbine design and software to “tune out” turbine signatures from radar is being developed
4) Noise pollution – The toughest challenges facing turbine designers and wind power may be the noise issue. Designers are working on technical turbine tweeks, but turbines will always make some degree of noise. http://www.youtube.com/watch?v=jRpcPbeZJEs&feature=related
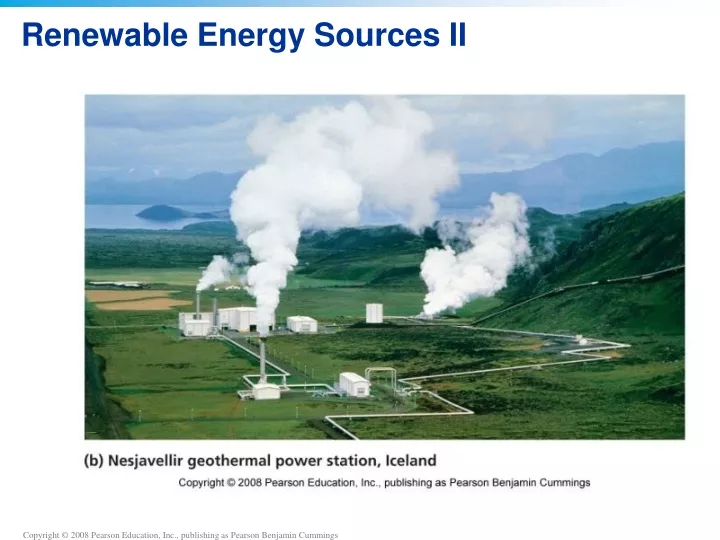
IV. Geothermal energy A. Renewable energy that does not originate from the Sun • It is generated from deep within the Earth B. Radioactive decay of elements under extremely high pressures deep inside the planet generates heat • This heat rises through magma, fissures, and cracks C. Geothermal power plants use heated water and steam for direct heating and generating electricity
Geothermal energy is renewable in principle D. If a geothermal plant uses heated water faster than groundwater is recharged, the plant will run out of water • Operators have begun injecting municipal wastewater into the ground to replenish the supply E. Patterns of geothermal activity shift naturally • An area that produces hot groundwater now may not always do so
F. Geothermal energy produces heat and electricity 1) Most often wells are drilled hundreds or thousands of meters toward heated groundwater • Water at temperatures of 150 – 370 degrees Celsius is brought to the surface and converted to steam, which turns turbines that generate electricity 2) Hot groundwater can be used directly to heat buildings • Cheap and efficient
Heat pumps are highly efficient G. Geothermal ground source heat pumps (GSHPs) use thermal energy from near-surface sources of earth and water 1) The pumps heat buildings in the winter by transferring heat from the ground into buildings 2) In the summer, heat is transferred through underground pipes from the building into the ground 3) Highly efficient, because heat is simply moved
Use of geothermal power is growing H) Currently, geothermal energy provides less than 0.5% of the total energy used worldwide • It provides more power than solar and wind combined • But, much less than hydropower and biomass I) Geothermal energy in the U.S. provides enough power to supply electricity to more than 4 million people J) The U.S., Japan, and China lead the world in geothermal power use (by kWh)
V. Hydrogen A. Electricity generated from renewable sources could be used to produce hydrogen B. Vehicles, computers, cell phones, home heating, and countless other applications could be powered C. Basing an energy system on hydrogen could alleviate dependence on foreign fuels and help fight climate change D. Governments are funding research into hydrogen and fuel cell technology to produce vehicles that run on hydrogen
E. Production of hydrogen fuel 1) Electrolysis = electricity is input to split hydrogen atoms from the oxygen atoms of water molecules: • 2H2O 2H2 + O2 • Produces pure hydrogen. Will cause some pollution depending on the source of electricity, but less than other processes
Other ways of obtaining hydrogen F. Hydrogen can also be obtained from biomass and fossil fuels, such as methane (CH4) • CH4 + 2H2O 4H2 + CO2 G. Results in emissions of carbon-based pollution H. Whether a hydrogen-based energy system is environmentally cleaner than a fossil fuel system depends on how the hydrogen is extracted I. Leakage of hydrogen could deplete stratospheric ozone
J. Fuel cells produce electricity 1) Once isolated, hydrogen gas can be used as a fuel to produce electricity within fuel cells 2) The chemical reaction involved in that fuel cell is the reverse of electrolysis • 2H2 + O2 2H2O 3) The movement of the hydrogen’s electrons from one electrode to the other creates electricity