Download
1 / 12
120 likes | 252 Vues
Trial profile. Fox K et al. Lancet 2008;372:807-16. Baseline characteristics. Fox K et al. Lancet 2008;372:807-16. Baseline characteristics of the subgroup with heart rate of 70 bpm or greater. Fox K et al. Lancet 2008;372:807-16.

E N D
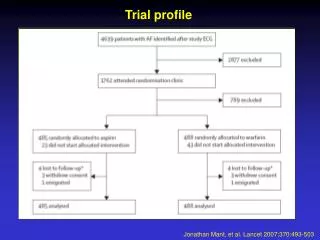
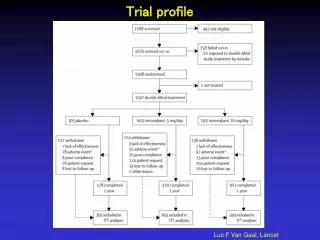
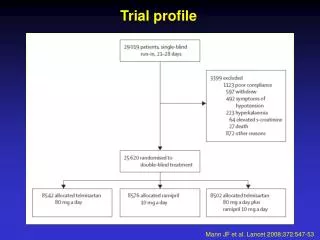
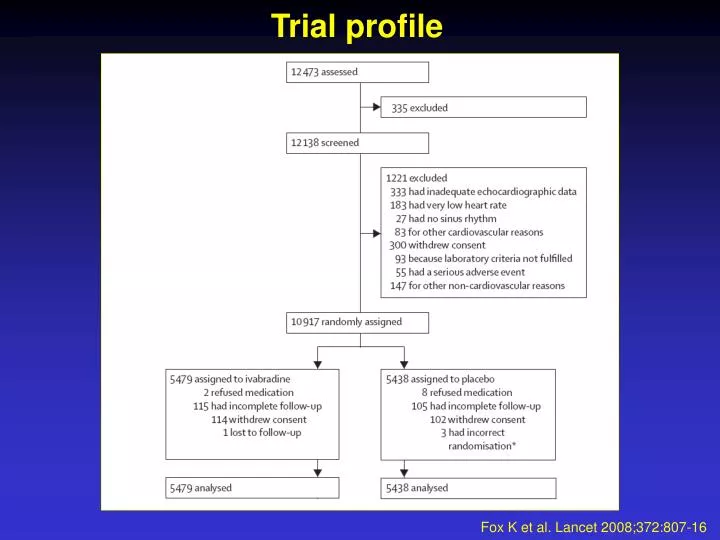
Trial profile Fox K et al. Lancet 2008;372:807-16
Baseline characteristics Fox K et al. Lancet 2008;372:807-16
Baseline characteristics of the subgroup with heart rate of 70 bpm or greater Fox K et al. Lancet 2008;372:807-16
Mean heart rate during the study (A) in the total study population and (B) in the subgroup with heart rate of 70 bpm or greater Fox K et al. Lancet 2008;372:807-16
Incidence of serious adverse events during the study by system organ class Fox K et al. Lancet 2008;372:807-16
Primary and secondary endpoints Fox K et al. Lancet 2008;372:807-16
Kaplan–Meier time-to-event plot, by treatment group for composite primary endpoint in the total study population Fox K et al. Lancet 2008;372:807-16
Effect of treatment on composite primary endpoint in prespecified subgroups Fox K et al. Lancet 2008;372:807-16
Kaplan–Meier time-to-event plot, by treatment group in the prespecified subgroup with heart rate of 70 bpm or greater for composite primary endpoint Fox K et al. Lancet 2008;372:807-16
Kaplan–Meier time-to-event plots, by treatment group in the prespecifi ed subgroup with heart rate of 70 bpm or greater, for the secondary endpoints of (A) admission to hospital for new-onset or worsening heart failure and (B) cardiovascular death or admission to hospital for new-onset or worsening heart failure Fox K et al. Lancet 2008;372:807-16
Kaplan–Meier time-to-event plots, by treatment group in the prespecifi ed subgroup with heart rate of 70 bpm or greater for the secondary endpoints of (A) admission to hospital for acute myocardial infarction endpoint and (B) admission to hospital for acute myocardial infarction or unstable angina Fox K et al. Lancet 2008;372:807-16
Kaplan–Meier time-to-event plot, by treatment group in the prespecified subgroup with heart rate of 70 bpm or greater for secondary endpoint of coronary revascularisation Fox K et al. Lancet 2008;372:807-16