Download
1 / 1
20 likes | 110 Vues
Genetic Variability of Lactoferrin Content Predicted by MIR Spectrometry : MIR Spectrometry + Quantitative Models : Keys to select animals in Molecular Genetic Studies.

E N D
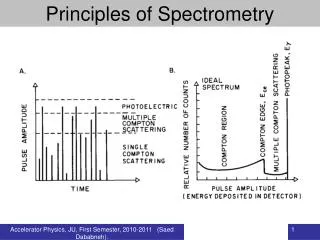
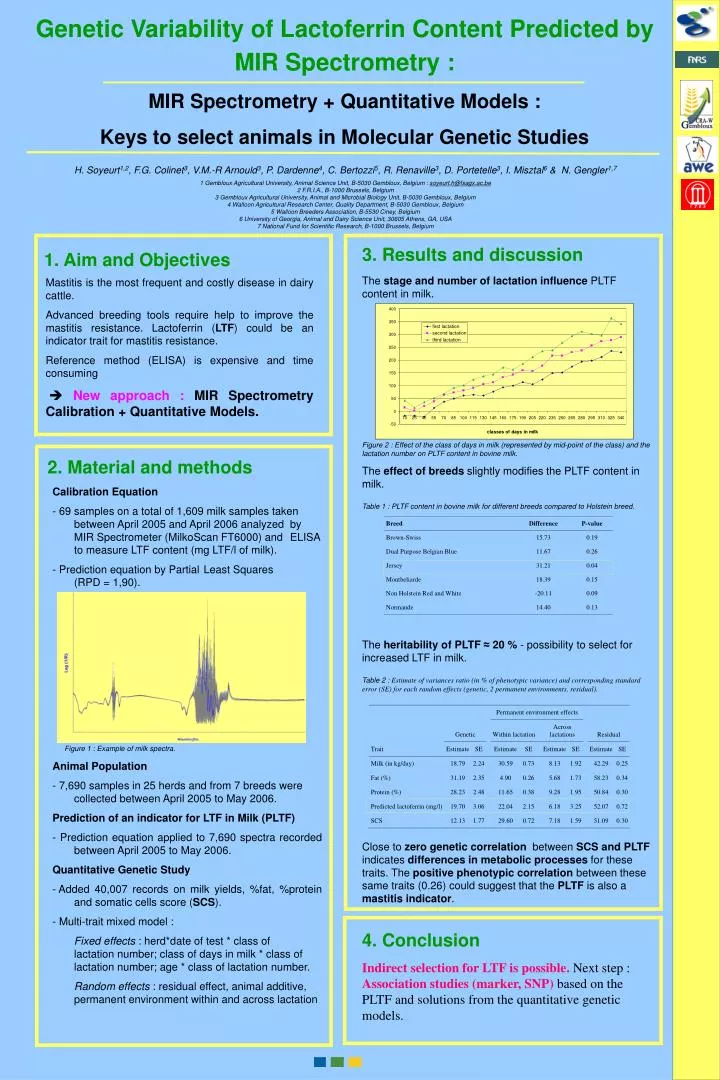
Genetic Variability of Lactoferrin Content Predicted by MIR Spectrometry : MIR Spectrometry + Quantitative Models : Keys to select animals in Molecular Genetic Studies H. Soyeurt1,2, F.G. Colinet3, V.M.-R Arnould3, P. Dardenne4, C. Bertozzi5, R. Renaville3, D. Portetelle3, I. Misztal6 & N. Gengler1,7 1 Gembloux Agricultural University, Animal Science Unit, B-5030 Gembloux, Belgium : soyeurt.h@fsagx.ac.be 2 F.R.I.A., B-1000 Brussels, Belgium 3 Gembloux Agricultural University, Animal and Microbial Biology Unit, B-5030 Gembloux, Belgium 4 Walloon Agricultural Research Center, Quality Department, B-5030 Gembloux, Belgium 5 Walloon Breeders Association, B-5530 Ciney, Belgium 6 University of Georgia, Animal and Dairy Science Unit, 30605 Athens, GA, USA 7 National Fund for Scientific Research, B-1000 Brussels, Belgium 3. Results and discussion 1. Aim and Objectives The stage and number of lactationinfluence PLTF content in milk. Figure 2 : Effect of the class of days in milk (represented by mid-point of the class) and the lactation number on PLTF content in bovine milk. The effect of breeds slightly modifies the PLTF content in milk. Table 1 : PLTF content in bovine milk for different breeds compared to Holstein breed. The heritability of PLTF≈20 % - possibility to select for increased LTF in milk. Table 2 : Estimate of variances ratio (in % of phenotypic variance) and corresponding standard error (SE) for each random effects (genetic, 2 permanent environments, residual). Close to zero genetic correlation between SCS and PLTF indicates differences in metabolic processes for these traits. The positive phenotypic correlation between these same traits (0.26) could suggest that the PLTF is also a mastitis indicator. Mastitis is the most frequent and costly disease in dairy cattle. Advanced breeding tools require help to improve the mastitis resistance. Lactoferrin (LTF) could be an indicator trait for mastitis resistance. Reference method (ELISA) is expensive and time consuming New approach :MIR Spectrometry Calibration + Quantitative Models. 2. Material and methods • Calibration Equation • 69 samples on a total of 1,609 milk samples taken between April 2005 and April 2006 analyzed by MIR Spectrometer (MilkoScan FT6000) and ELISA to measure LTF content (mg LTF/l of milk). • Prediction equation by Partial Least Squares (RPD = 1,90). • Figure 1 : Example of milk spectra. • Animal Population • 7,690 samples in 25 herds and from 7 breeds were collected between April 2005 to May 2006. • Prediction of an indicator for LTF in Milk (PLTF) • - Prediction equation applied to 7,690 spectra recorded between April 2005 to May 2006. • Quantitative Genetic Study • Added 40,007 records onmilk yields, %fat, %protein and somatic cells score (SCS). • Multi-trait mixed model : • Fixed effects : herd*date of test * class of lactation number; class of days in milk * class of lactation number; age * class of lactation number. • Random effects : residual effect, animal additive, permanent environment within and across lactation 4. Conclusion Indirect selection for LTF is possible. Next step : Association studies (marker, SNP) based on the PLTF and solutions from the quantitative genetic models.