Download
1 / 13
130 likes | 283 Vues
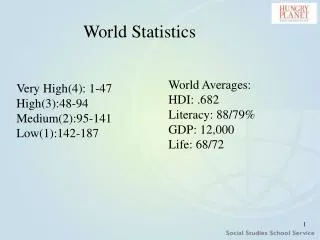
AGEC/FNR 406 LECTURE 33. Groundwater nitrate risk:. Low Medium High Very High. Source: http://pasture.ecn.purdue.edu/~frankenb/watershedmap.html. Types of water pollutants.

E N D
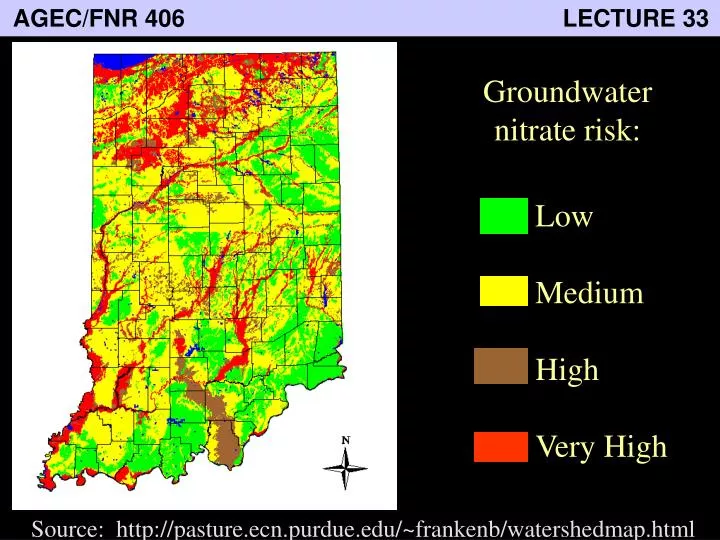
AGEC/FNR 406 LECTURE 33 Groundwater nitrate risk: LowMediumHighVery High Source: http://pasture.ecn.purdue.edu/~frankenb/watershedmap.html
Types of water pollutants 1. Organic wastes: degradable wastes, residuals, some chemicals (detergents, pesticides, oil). 2. Inorganic substances: toxic metals, salts, acids, nitrate and phosphorous compounds. 3. Nonmaterial pollutants: heat, radioactivity. 4. Infectious agents: bacteria, viruses.
Sources of water pollutants 1. Point sources: industry and municipal sewage treatment plants. “end of the pipe” typically continuous emission typically governed by Federal (EPA) standards 2. Nonpoint sources: agriculture, yard, and street runoff hard to monitor episodic governed by states
Federal Policy 1965 Water Quality Act required states to set ambient standards for water quality1972 Water Pollution Control Act Amendments set a “zero discharge” standard (inefficient!) set technology-based effluent standards and federal discharge permits1977 Clean Water Act required Best Conventional Technology
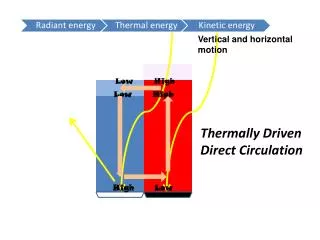
Biological Oxygen Demand (BOD) High quality water is usually associated with a high level of dissolved oxygen (DO). DO is typically used up in the degradation process.Main source is treated municipal wastewater.One way to measure water quality is via “biochemical oxygen demand.”
DO profile DOppm Time or distance
Transfer coefficient A transfer coefficient measures the per unit relationship between a level of emission at a source and a constant concentration of the pollutant at a receptor site.
Transfer coefficient I ai Ei + B KR = i =1 KR = concentration at receptor site ai = transfer coefficient Ei = emission level of ith source B = background emission, if any
Cost-effective clean up Policy Goal: Obtain given concentration target (not emission target) at minimum cost. Procedure: translate emission reduction into concentration reduction. Concentration = emission x transfer coefficientMC of concentration reduction = MC of emission reduction / transfer coefficient
Example Two sources, one receptor site. EA= 10/day, a = 0.50, MC = 100 R EB= 10/day, a = 1.0, MC = 100 Concentration at R = 10*.5 + 10*1.0 = 15 MC of concentration reduction = 100/0.5 = 200 for A MC of concentration reduction = 100/1.0 = 100 for B
Zone Approach B C A R Standards based on zone may be useful when monitoring costs are high
Key Points Goal: reduce damages at receptor site at lowest cost How: balance the impact each polluter has (not on emission, but on concentration) with cost of reducing damages (in terms of concentration) Key concept: Target concentration, not emission.