Download
1 / 15
150 likes | 304 Vues
MAN versus Off-peak Background Measurements. What Is It Good For? Saving TIME!. How Much Time?. 186 seconds w/ Off-Peaks. 94 seconds w/ MAN. What Else is it Good For?. Avoiding Off-Peak Interferences Spectrometer Reproducibility Issues Sensitive Samples Quantitative Imaging

E N D
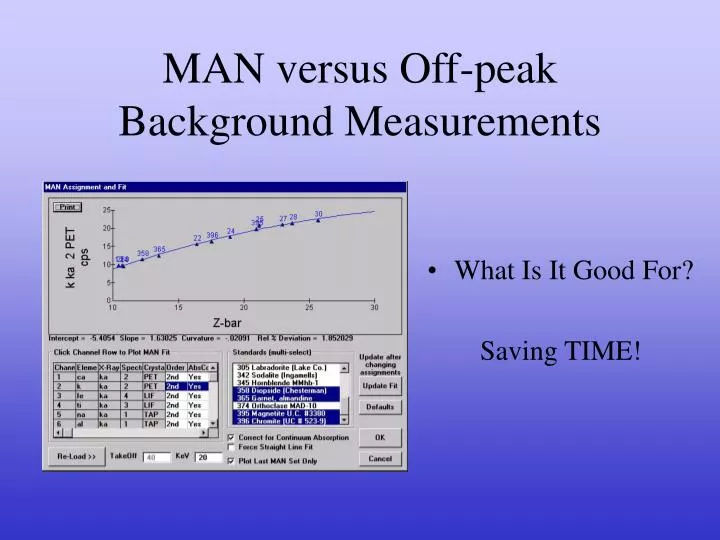
MAN versus Off-peak Background Measurements • What Is It Good For? Saving TIME!
How Much Time? 186 seconds w/ Off-Peaks 94 seconds w/ MAN
What Else is it Good For? • Avoiding Off-Peak Interferences • Spectrometer Reproducibility Issues • Sensitive Samples • Quantitative Imaging • Avoiding Wear and Tear on Spectrometers
Avoiding Off-Peak Interferences By not measuring off-peak intensities in samples of unknown composition, one can eliminate even unforseen off-peak interferences.
Spectrometer Reproducibility Issues • Ultra High Precision Measurements • Handle spectrometer re-positioning problems By reserving a spectrometer for a single MAN corrected element x-ray line (monochromator), one can obtain:
Sensitive Samples Na/K Loss in glass (or Si/Al “grow-in”) • Everyone knows about sodium loss over time in some glasses and especially, hydrous phases- but did you know that sodium can also “grow-in”?
Quantitative Imaging • Eliminate acquisition time for off-peak intensity images and still obtain background corrected quantitative images (512 x 2048 pixels @ .5 sec equals 6 days!)
How Good Is It? • Major Elements • Minor Elements • Trace Elements • Comparison to Off-Peak Measurements • Matrix Issues (Low Z-bar vs High Z-bar) • Accuracy (reproducibility, drift, etc)
Comparison with Off-peak Off-Peak 20 kev, 20 nA, 5 um, 20 sec on, 20 sec off St 305 Set 2 Labradorite (Lake Co.) ELEM: Ca K Fe Ti Na Al Mn Ni O H Si SUM AVER: 9.625 .102 .326 .023 2.841 16.529 .008 .003 46.823 .000 23.957 100.239 SDEV: .036 .008 .018 .014 .039 .032 .008 .005 .000 .000 .000 %RSD: .4 7.7 5.5 61.8 1.4 .2 89.4 165.7 .0 .0 .0 PUBL: 9.577 .100 .319 n.a. 2.841 16.359 .000 n.a. 46.823 n.a. 23.957 99.976 %VAR: .51 1.69 2.29 .00 .01 1.04 .00 .00 .00 .00 .00 DIFF: .048 .002 .007 .000 .000 .170 .000 .000 .000 .000 .000 STDS: 358 374 395 22 305 374 25 28 0 0 0 PKBG: 137.20 3.16 4.33 1.35 34.33 217.83 1.09 1.00 .00 .00 .00 MAN St 305 Set 2 Labradorite (Lake Co.) ELEM: Ca K Fe Ti Na Al Mn Ni O H Si SUM AVER: 9.640 .100 .321 .023 2.864 16.543 .002 .004 46.823 .000 23.957 100.277 SDEV: .034 .007 .017 .012 .037 .033 .003 .005 .000 .000 .000 %RSD: .3 7.1 5.4 51.9 1.3 .2 140.3 126.3 .0 .0 .0 PUBL: 9.577 .100 .319 n.a. 2.841 16.359 .000 n.a. 46.823 n.a. 23.957 99.976 %VAR: .65 .23 .78 .00 .81 1.13 .00 .00 .00 .00 .00 DIFF: .063 .000 .002 .000 .023 .184 .000 .000 .000 .000 .000 STDS: 358 374 395 22 305 374 25 28 0 0 0 PKBG: 171.37 3.06 4.10 1.33 47.17 258.11 1.00 .99 .00 .00 .00
High Z-bar Off Peak Comparison Off-Peak 20 kev, 20 nA, 5 um, 20 sec on, 20 sec off St 396 Set 2 Chromite (UC # 523-9) ELEM: Ca K Fe Ti Na Al Mn Ni O H Cr SUM AVER: .002 .004 20.392 .333 .006 8.004 .162 .087 33.042 .000 31.905 100.349 SDEV: .003 .005 .109 .021 .009 .036 .013 .014 .000 .000 .000 .000 %RSD: 114.0 129.1 .5 6.5 156.9 .5 8.0 15.9 .0 .0 .0 .0 PUBL: n.a. n.a. 20.692 .300 n.a. 7.690 .225 n.a. 33.042 n.a. 31.905 100.266 %VAR: .00 .00 -1.45 10.84 .00 4.09 -28.03 .00 .00 .00 .00 .00 DIFF: .000 .000 -.300 .033 .000 .314 -.063 .000 .000 .000 .000 .000 STDS: 358 374 395 22 305 374 25 28 0 0 0 0 PKBG: 1.00 1.04 101.90 4.90 1.01 73.21 2.07 1.44 .00 .00 .00 .00 MAN St 396 Set 2 Chromite (UC # 523-9) ELEM: Ca K Fe Ti Na Al Mn Ni O H Cr SUM AVER: .001 .001 20.441 .346 .007 7.976 .155 .087 33.042 .000 31.905 100.372 SDEV: .002 .002 .109 .016 .009 .036 .014 .008 .000 .000 .000 .000 %RSD: 316.2 223.9 .5 4.5 118.4 .5 9.1 9.0 .0 .0 .0 .0 PUBL: n.a. n.a. 20.692 .300 n.a. 7.690 .225 n.a. 33.042 n.a. 31.905 100.266 %VAR: .00 .00 -1.21 15.40 .00 3.72 -31.27 .00 .00 .00 .00 .00 DIFF: .000 .000 -.251 .046 .000 .286 -.070 .000 .000 .000 .000 .000 STDS: 358 374 395 22 305 374 25 28 0 0 0 0 PKBG: .98 .98 133.63 5.76 1.04 57.37 1.97 1.44 .00 .00 .00 .00
Drift Issues in MAN Drift array background intensities for standards: ELMXRY: ca ka k ka fe ka ti ka na ka al ka mn ka ni ka MOTCRS: 2 PET 2 PET 4 LIF 3 LIF 1 TAP 1 TAP 3 LIF 4 LIF STDASS: 358 374 395 22 305 374 25 28 19.3 15.7 33.0 20.3 9.3 28.5 25.1 46.8 20.0 15.6 33.0 21.2 9.9 28.9 25.8 47.5 Drift array standard intensities (background corrected): ELMXRY: ca ka k ka fe ka ti ka na ka al ka mn ka ni ka MOTCRS: 2 PET 2 PET 4 LIF 3 LIF 1 TAP 1 TAP 3 LIF 4 LIF STDASS: 358 374 395 22 305 374 25 28 4564.9 2741.4 6926.4 2341.0 325.7 3296.5 6976.5 8176.6 4583.7 2745.9 6884.5 2305.0 327.5 3272.7 6960.2 8192.3
Trace Ni “contamination” removed (natural chromite, 0.087 wt. % Ni)