Download
1 / 20
200 likes | 334 Vues
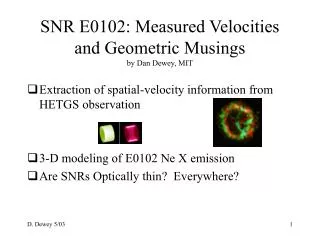
Towards a 3D Model of SNR E0102-72. D. Dewey, C.R. Canizares, K.A. Flanagan, A. Fredericks, J.C. Houck, M.S. Noble, and M.W. Wise MIT Center for Space Research Contact: dd@space.mit.edu. Abstract / Outline. Introduction SNR E0102-72: What we know about it… Beginnings of a 3D model…

E N D
Towards a 3D Model ofSNR E0102-72 D. Dewey, C.R. Canizares, K.A. Flanagan, A. Fredericks, J.C. Houck, M.S. Noble, and M.W. Wise MIT Center for Space Research Contact: dd@space.mit.edu 4 years of Chandra Observations, Sept. 2003
Abstract / Outline • Introduction • SNR E0102-72: • What we know about it… • Beginnings of a 3D model… • 3D Modeling for Astrophysics Chandra with its high spatial and spectral resolution provides details and clues that can give information on the 3-D structure of X-ray sources. In this work we summarize what we've learned from Chandra about the supernova remnant E0102-72 in the SMC , including: progressive radial ionization in the reverse shocked ejecta, temperature variations in the remnant, an outer blast wave component, and spatial-velocity structure suggestive of roughly cylinderical ejecta emission. We then create simple 3-D data structures to model these feature of the remnant and derive relevant quantities. Some of the directions here may be is useful in 3-D modeling of other X-ray systems, both resolved (e.g., clusters of galaxies) and unresolved (e.g., accretion disk systems.) 4 years of Chandra Observations, Sept. 2003
Introduction / Summary Chandra's superb imaging, spectral imaging and high-resolution spectral capabilities give a clearer and more detailed view of the complexity of Supernova remnants such as E0102-72 in the Small Magellanic Cloud (Flanagan et al. 2003). Data from HETG observations of E0102 suggest a cylinderical shape to the ejecta; ring-like models have been presented in the past (Hughes 1994.) However, using the Chandra data we the ability to do more detailed 3D modeling. The general problem of describing and fitting 3D models to X-ray (and Radio, IR, visible, UV,…) observations is a many headed monster but given the state of 3D tools and our astrophysics we should be able to tame it. 4 years of Chandra Observations, Sept. 2003
Future work in these areas… • E0102 Observations Analysis • Create color-velocity map for O VIII line. • E0102 3D Modeling • Create detailed spatial model, e.g.: T(xyz), tau(xyz), Abundances(xyz), Velocity(xyz). • "Hydra" 3D Modeling/Fitting Project • Interface Blender(etc.) to X-ray spectral code 4 years of Chandra Observations, Sept. 2003
References • Antunes, A. and Wallin, J., :"Projecting 3-D Simulations Into Pseudo Observations", in ASP Conf. Ser., Vol. 295 ADASS XII, 439 (2003) • BinSim - http://www.astro.soton.ac.uk/~rih/binsim.html - "a code to produce images of interacting binary stars" by R.I. Hynes; it uses C++ and the Mesa 3D graphics library. • Blender - http://www.blender3d.org - "fully integrated 3D graphics creation suite." The program's source code is available under the GNU General Public License. • Flanagan, K.A. et al., "Chandra High-Resolution X-Ray Spectrum of Supernova Remnant 1E0102.2-7219, ApJ submitted (2003) • Hughes, J.P., "ROSAT HRI Observations of Magellanic Cloud Supernova Remnants (I)", in AIP Conf. Proc. #313, p.144 (1994) • Kinkhabwala,A. et al., "Atomic Calculations and Spectral Models of X-ray Absorption and Emission Features From Astrophysical Photoionized Plasmas", ApJ submitted and astro-ph/0304332 (2003) • Maya - http://www.alias.com/eng/products-services/maya/ - 3D animation and effects software; commercial product ("personal learning edition" available for small fee.) • Peterson, J.R. et al., "High Resolution X-Ray Spectroscopic Constraints On Cooling-Flow Models", a talk at "The Riddle of Cooling Flows in Galaxies and Clusters of Galaxies", Charlottesville, VA, USA. May 31 -- June 4(2003) 4 years of Chandra Observations, Sept. 2003
E0102: What we know… • Bright thin ring of reverse-shocked ejecta, primarilly O and Ne. • An outer blast wave shell. • Radial "spokes" of material. Color-intensity images of E0102 (right) and Cas A (left). The Cas A image has been degraded as if it were observed at the distance of E0102. Cas A 4 years of Chandra Observations, Sept. 2003
HETGS Observations Top: Zeroth-order and dispersed MEG spectrum of E0102. Right: Extracted spectrum (orange) and global model fit to the data (purple.) The high-resolution underlying spectral model is shown by the green curve. 4 years of Chandra Observations, Sept. 2003
Ionization Structure At right the dispersed images of various He-like ions (left column) and H-like ions(right column) are shown from the MEG spectrum. Measuring the location of the SE arc and N shelf shows a clear trend with the tau of maximum emissivity which can be interpreted as resulting from the passage of the reverse shock through the ejecta. 4 years of Chandra Observations, Sept. 2003
Plasma Conditions Oxygen line ratios were used to fit vpnshock models to the two bright regions indicated in the image above. The resulting temperatures are very similar - in contrast to the high-energy gradient seen between these regions (right image p.11) 4 years of Chandra Observations, Sept. 2003
Analysis of the Ne X dispersed images suggests regions of red and blue shift appearing on the sky as displaced rings. Red: 900 and 1800 km/s Green: -900 km/s Blue: -1800 km/s Interpret this as cylinder viewed almost end-on: Ne X Spatial-Velocity Map 4 years of Chandra Observations, Sept. 2003
Beginnings of a 3D Model… • Bright inner rings of ejecta. • Outer shell of the blast wave. • Hughes 1994 ring + shell model. Left: E0102 filtered on Oxygen lines ~0.5 to 0.7 keV. Right: E0102 filtered above 2 keV showing the gradient in high-energy flux and enhancing the outer blast wave limits. 4 years of Chandra Observations, Sept. 2003
Optically "thick" and "thin" views • IDL project_vol.pro used here, wrapped into "v3d_project.pro" • Optically thick and thin views of a cylinder intensity array. Optically thick view Optically thin (i.e. X-ray) view • Maximum value along a ray is used. • The material has an opacity. • Depth cuing darkens distant points. • Sum of values along a ray is used. • The material has NO opacity. • No change in intensity with distance. 4 years of Chandra Observations, Sept. 2003
Three models • Three geometric models for E0102 emission have been used in preliminary modeling work: • Hughes 1994 model: an inner ring formed from a partial sphere is embedded in a larger outer spherical shell. The model is viewed on-axis. Hughes also added discrete points which are not included here. • Our internal "Gaussian-tire" model: a Gaussian variation in intensity with lattitude and a power-law variation with radius is viewed 34 degrees off axis. This model does well in fitting the cross-dispersion edge profile. • A cylinder based on the Ne X spatial-velocity map is embedded in an outer spherical shell and view about 17 degress off axis. 4 years of Chandra Observations, Sept. 2003
Optically thick views of the models Blastwave sphere Side view Hughes 1994 "Gaussian tire" Cylinder w/shell 4 years of Chandra Observations, Sept. 2003
E0102 Models and Data… Above are sky color-intensity images produced by the three models considered (left to right): spherical ring plus shell (Hughes 1994), "Gaussian-tire" model, and the Ne X cylinder plus spherical shell. At right is the E0102 zeroth-order image to the same spatial and intensity scale as the models. There is much structure left to model! 4 years of Chandra Observations, Sept. 2003
3D Modeling for Astrophysics • We need to "decipher" spectra to arrive at a model - a.k.a. creating a "Scientist's Impression". • 3D modeling can be helpful for extended sources but is essential for unresolved ("point") sources, e.g. modeling of photoionized systems, Kinkhabwala et al. 2003. "What's my model ?" 4 years of Chandra Observations, Sept. 2003
"What's my spectrum ?" 4 years of Chandra Observations, Sept. 2003
"Hydra" Diagram This block diagram shows the many components to the full 3D modeling problem for astrophysics modelling. It is similar to one shown in Peterson et al. 2003 but has more emphasis on the 3D modeling component. "In some cases, modeling can point out conceptual flaws, in other cases our model will simply regurgitate our expectations." - Antunes & Wallin 2003 (Hydra graphic from: http://www.pantheon.org/areas/gallery/folklore/greek_heroic/hydra.html) 4 years of Chandra Observations, Sept. 2003
From "Schematic" to "Rendering" • The starting point for the creation of a 3D model is inputing in schematic form the geometry, material properties, sources of illumination, etc for the model. It is likely that commercial or free software packages (e.g., Maya and Blender) are fully up to supporting the definition of astrophysical models. • Once the model is defined a view of it can be created or "rendered" using the (X-ray) optical properties of the materials. The challenge for astrophysics is to create "renderers" that work as well for our observation bands as Pixar's does in the visible band! Note the impressive start by Rob Hynes with his BinSim code for binary systems. • A final step for X-ray modeling might be the generation of discrete rays from the source; each ray retaining sky location, precise wavelength and time of emission for use as input to an event-based instrument model, e.g., the Monte Carlo modeling in Peterson et al. 2003. 4 years of Chandra Observations, Sept. 2003
Instrument Modeling In general we'd expect to pass the 3D model rendered data through the instrument model to include instrument blurring etc. However depending on the analysis a simple approximation to the instrument may be sufficient. Comparing and Fitting Unlike the case of comparing and fitting a measured spectrum to a model spectrum, once we have spatial and spectral components in our model (and data) more complex comparisons can be created, e.g., for E0102 modeling the ratio of distributed emission inside the ring to the blastwave intensity. These comparisons can focus on known properties of the parameters. 4 years of Chandra Observations, Sept. 2003