Download
1 / 25
250 likes | 374 Vues
Galaxy Clustering Topology in the Sloan Digital Sky Survey. Yun-Young Choi Kyunghee University. Collaborators. Changbom Park (KIAS) Juhan Kim (KIAS) Rich Gott (Princeton U.) Michael Vogeley (Drexel U.) David Weinberg (Ohio State U.). Topology of Large scale structure.

E N D
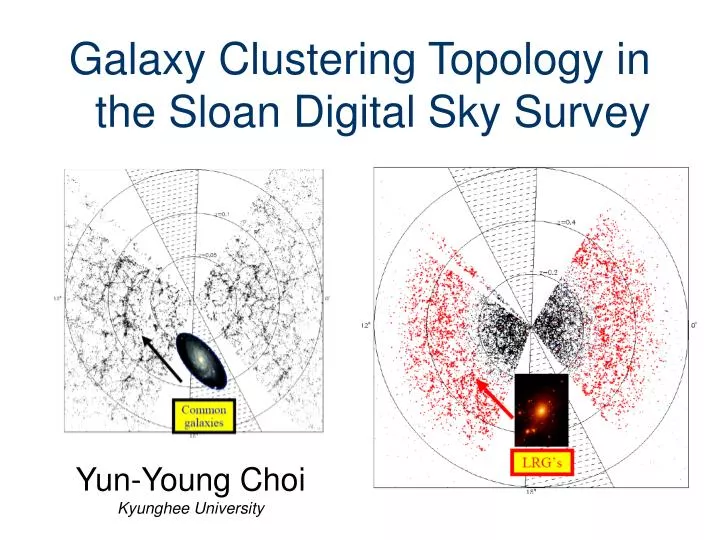
Galaxy Clustering Topology in the Sloan Digital Sky Survey Yun-Young Choi Kyunghee University
Collaborators Changbom Park (KIAS) Juhan Kim (KIAS) Rich Gott (Princeton U.) Michael Vogeley (Drexel U.) David Weinberg (Ohio State U.)
Topology of Large scale structure Standard cosmological model: 1. LSS arises from primordial zero-point energy-density fluctuations (Bardeen, Steinhardt & Turner 1983) 2. The density fluctuations have random phases or a Gaussian density distribution; which has a known topology. The gaussian random field has analytically calculable genus curve. Departures of the genus curve from the random phase shape: variation in the PS slope, skewness in the initial density field, biasing in the distribution of galaxies relative to mass, redshift space distortion, gravitational evolution, and so on. Probe of the non-Gaussianity !
Topological Genus (Gott, Melott & Dickinson 1986) Isodensity contour surfaces at a given density threshold level G = (number of holes in the surface of constant density)- (number of isolated regions surrounded by the surfaces) Genus analysis of LSS
Advantages of Genus Measurement Advantage for the detection of the non-gaussianity Gaussian random field has analytically calculable genus curve; g = G/V : threshold density in units of standard deviation of
What do we expect the genus curve to look like? Many holes Multiply connected Isolated clusters & voids (Weinberg, Gott & Melott 1987) “Meat-ball Topology“ “Swiss-cheese Topology“
Genus-Related Statistics Amplitude drop RA RA = Aobs / ARP-PS Shift parameter of the peak, Δν: By fitting Gobs(ν) over –1<ν<1 Asymmetry parameters AV & AC A = ∫ Gobs(ν) d ν/∫ Gfit(ν) d ν where intervals are -1.2~-2.2 (AV), 1.2~2.2 (AC) g △ν AC AV To Measure the departures of the observed genus curve from the random phase expectation
Final SDSS DR7 Main Galaxy Sample (Choi et al. 2010)
The Cosmic Runner (Park et al. 2005) The Sloan Great Wall (Gott et al. 2005) The CfA Great Wall & the man (de Lapparent et al. 1986)
g △ν AV AC G=373 ±18 (4.7%) SDSS Main galaxies Error estimates from 27 mock surveys (20483p1433.6s, 20483p1024s LCDM sim.) Choi et al. 2010 Fewer voids and fewer superclusters when compared with the Gaussian genus curve: voids and superclusters are more connected.
Morphology and color dependence of LSS Topology Galaxy Properties-environment(LSS) relation
Results: Distribution of early-type/red galaxies has smaller genus density, is more meat-ball shifted, has more isolated clusters, and fewer voids.
Test of Galaxy Formation Models • Whether or not various models of galaxy formation are consistent • with measurement of the SDSS galaxy clustering topology? 1. HGC, a Halo-Galaxy one-to-one Correspondence model [Kim, Park & Choi 2008] • Each gravitationally self-bound, tidally stable dark halo (central or sub halo) above certain mass contains one galaxy above certain luminosity. Only galaxy number density is used to constrain the model. 2. HOD, Halo Occupation Distribution [Yang et al. 2007] Galaxies populating in the dark halos with a halo occupation distribution model 3. SAM, Semi-Analytic Models of galaxy formation Merger-tree + physical processes put in Croton et al. (2006) & Bower et al. (2006)'s of SAM (which differ mainly by AGN feedback and cooling); Bertone et al. (2007)'s SAM (galactic wind)
Deviations due to combined effects of initial condition, gravitational evolution and biasing depend on models.
Bertone et al. 2007 Yang et al. 2007 Croton et al. 2006 Bower et al. 2006 Kim et al. 2008 SDSS DR7 Main 1. Amplitude agrees - PS (but Bower et al. !) 2. too positive : all models show sponge topology (too positive thresholds). 3. Strongly disagree with observed void and cluster abundances. Overall, no model reproduces all features of the observed topology!
To estimate the statistical significance of the failure of each model i: the four genus-related statistics j: the two volume-limited samples Curve: Vobs is replaced by the average value over the 64 mock samples. No existing galaxy formation models reproduce the topology of the SDSS main galaxy sample near the smoothing scales, 6.1 and 7.1 h-1Mpc. The probability for the HGC model to be consistent with the observation is only 0.4%. The HOD and three SAM models are absolutely ruled out by this test.
Color subsets: red vsblue : 9.1 h-1Mpc scale : 7.0 h-1Mpc scale Color subsets of SAM mock galaxies completely fail to explain the observed topology.
Findings … [ Observations ] 1. Topology of LSS measured from SDSS DR7 2. Dependence of LSS topology on scale, luminosity, morphology & color is measured. Early-type/red galaxies has smaller genus, is more meat-ball shifted, has more clusters, 3. Topology bias of galaxy distribution with respect to matter is measured. Topology bias is significantly large and scale-dependent. [ Comparison with galaxy formation models ] 4. Topology at quasi- and non-linear scales can be used to constrain galaxy formation mechanism. All models fail to explain the observed meat-ball shift of large-scale galaxy distribution. SAM and HOD models fail to explain cluster and void abundances. Color subsets of SAM models completely fail to explain the observed topology. Galaxy formation models should be tuned to explain not only the amplitude but also the topology of galaxy clustering!
2. SDSS DR7 Luminous Red Galaxies LRGs (red dots) provide six times more cosmological information than typical ones.
G=282.7 ±11.1 (3.9%) • 129 Mock LRGs: • 43 independent Past light cone data:LCDM simulations (60003p7200s, 72103p10815s, 41203p6592s), Halo-galaxy assignment (HGC models), PSB halo finding • For the most massive galaxies, the HGC model does seem to work well. initially Gaussian ΛCDM model successfully reproduces the observed topology of LRGs at large Scales. • Comparison with the random phase • expectation: • Meat ball shifted and more connected • voids and more isolated clusters. • Comparison with Perturbation Theory expectation: • Gravitational evolution effects on genus. Void part can not be explained by perturbation theory. Analytic formula for the genus in weakly nonlinear regime due to gravitational evolution Matsubara (1994)
Effect of finite sampling and redshift space distortionon genus curve The redshift space distortion effects on the genus curve are small in the weakly-linear scales.
DR 7 Main Galaxies DR 7 Luminous Red Galaxies
Findings.. For the most massive galaxies, the HGC model (Kim et al. 2008) does seem to work well. Initially Gaussian ΛCDM model successfully reproduce the observed topology of LRGs at 21h-1Mpc scales. LRG distribution has meat ball topology. Voids are more connected and clusters are more isolated when compared with the Gaussian genus curve. The deviation from the random phase expectation can be explained by perturbation theory: Gravitational evolution effects on genus. Still, void abundance in very low density regions ( < -2) are not explained.