Download
1 / 37
550 likes | 1.07k Vues
Lecture 1 – Waves & Sound. c) Sound. Units of Chapter 16. Characteristics of Sound Intensity of Sound: Decibels Sources of Sound: Vibrating Strings and Air Columns Quality of Sound, and Noise; Superposition Doppler Effect Applications: Sonar, Ultrasound, and Medical Imaging.

E N D
Lecture 1 – Waves & Sound c) Sound
Units of Chapter 16 • Characteristics of Sound • Intensity of Sound: Decibels • Sources of Sound: Vibrating Strings and Air Columns • Quality of Sound, and Noise; Superposition • Doppler Effect • Applications: Sonar, Ultrasound, and Medical Imaging
16-1 Characteristics of Sound Sound can travel through any kind of matter, but not through a vacuum. The speed of sound is different in different materials; in general, it is slowest in gases, faster in liquids, and fastest in solids. The speed depends somewhat on temperature, especially for gases.
16-1 Characteristics of Sound Loudness: related to intensity of the sound wave Pitch: related to frequency Audible range: about 20 Hz to 20,000 Hz; upper limit decreases with age Ultrasound: above 20,000 Hz; see ultrasonic camera focusing in following example Infrasound: below 20 Hz
16-1 Characteristics of Sound Example 16-2: Autofocusing with sound waves. Older autofocusing cameras determine the distance by emitting a pulse of very high frequency (ultrasonic) sound that travels to the object being photographed, and include a sensor that detects the returning reflected sound. To get an idea of the time sensitivity of the detector, calculate the travel time of the pulse for an object (a) 1.0 m away, and (b) 20 m away.
16-2 Mathematical Representation of Longitudinal Waves Longitudinal waves are often called pressure waves. The displacement is 90° out of phase with the pressure.
16-3 Intensity of Sound: Decibels The intensity of a wave is the energy transported per unit time across a unit area. The human ear can detect sounds with an intensity as low as 10-12 W/m2 and as high as 1 W/m2. Perceived loudness, however, is not proportional to the intensity.
16-3 Intensity of Sound: Decibels The loudness of a sound is much more closely related to the logarithm of the intensity. Sound level is measured in decibels (dB) and is defined as: I0 is taken to be the threshold of hearing:
16-3 Intensity of Sound: Decibels Example 16-3: Sound intensity on the street. At a busy street corner, the sound level is 75 dB. What is the intensity of sound there?
16-3 Intensity of Sound: Decibels Conceptual Example 16-5: Trumpet players. A trumpeter plays at a sound level of 75 dB. Three equally loud trumpet players join in. What is the new sound level?
16-3 Intensity of Sound: Decibels An increase in sound level of 3 dB, which is a doubling in intensity, is a very small change in loudness. In open areas, the intensity of sound diminishes with distance: However, in enclosed spaces this is complicated by reflections, and if sound travels through air, the higher frequencies get preferentially absorbed.
16-3 Intensity of Sound: Decibels The intensity can be written in terms of the maximum pressure variation. With some algebraic manipulation, we find:
16-3 Intensity of Sound: Decibels The ear’s sensitivity varies with frequency. These curves translate the intensity into sound level at different frequencies.
16-4 Sources of Sound: Vibrating Strings and Air Columns Musical instruments produce sounds in various ways—vibrating strings, vibrating membranes, vibrating metal or wood shapes, vibrating aircolumns. The vibration may be started by plucking, striking, bowing, or blowing. The vibrations are transmitted to the air and then to our ears.
16-4 Sources of Sound: Vibrating Strings and Air Columns This table gives frequencies for the octave beginning with middle C. The equally tempered scale is designed so that music sounds the same regardless of what key it is transposed into.
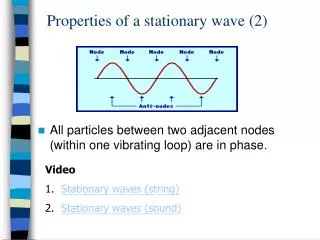
16-4 Sources of Sound: Vibrating Strings and Air Columns This figure shows the first three standing waves, or harmonics, on a fixed string.
16-4 Sources of Sound: Vibrating Strings and Air Columns The strings on a guitar can be effectively shortened by fingering, raising the fundamental pitch. The pitch of a string of a given length can also be altered by using a string of different density.
16-4 Sources of Sound: Vibrating Strings and Air Columns Example 16-8: Piano strings. The highest key on a piano corresponds to a frequency about 150 times that of the lowest key. If the string for the highest note is 5.0 cm long, how long would the string for the lowest note have to be if it had the same mass per unit length and was under the same tension?
16-4 Sources of Sound: Vibrating Strings and Air Columns • Example 16-9: Frequencies and wavelengths in the violin. • A 0.32-m-long violin string is tuned to play A above middle C at 440 Hz. • What is the wavelength of the fundamental string vibration, and • (b) What are the frequency and wavelength of the sound wave produced? • (c) Why is there a difference?
16-4 Sources of Sound: Vibrating Strings and Air Columns The sound waves from vibrating strings need to be amplified in order to be of a practical loudness; this is done in acoustical instruments by using a sounding board or box, creating a resonant chamber. The sound can also be amplified electronically.
16-4 Sources of Sound: Vibrating Strings and Air Columns Wind instruments create sound through standing waves in a column of air.
16-4 Sources of Sound: Vibrating Strings and Air Columns A tube open at both ends (most wind instruments) has pressure nodes, and therefore displacement antinodes, at the ends.
16-4 Sources of Sound: Vibrating Strings and Air Columns A tube closed at one end (some organ pipes) has a displacement node (and pressure antinode) at the closed end.
16-4 Sources of Sound: Vibrating Strings and Air Columns Example 16-10: Organ pipes. What will be the fundamental frequency and first three overtones for a 26-cm-long organ pipe at 20°C if it is (a) open and (b) closed?
16-7 Doppler Effect The Doppler effect occurs when a source of sound is moving with respect to an observer. A source moving toward an observer appears to have a higher frequency and shorter wavelength; a source moving away from an observer appears to have a lower frequency and longer wavelength.
16-7 Doppler Effect If we can figure out what the change in the wavelength is, we also know the change in the frequency.
16-7 Doppler Effect The change in the frequency is given by: If the source is moving away from the observer:
16-7 Doppler Effect If the observer is moving with respect to the source, things are a bit different. The wavelength remains the same, but the wave speed is different for the observer.
16-7 Doppler Effect We find, for an observer moving toward a stationary source: And if the observer is moving away:
16-7 Doppler Effect Example 16-14: A moving siren. The siren of a police car at rest emits at a predominant frequency of 1600 Hz. What frequency will you hear if you are at rest and the police car moves at 25.0 m/s (a) toward you, and (b) away from you?
16-7 Doppler Effect Example 16-15: Two Doppler shifts. A 5000-Hz sound wave is emitted by a stationary source. This sound wave reflects from an object moving toward the source. What is the frequency of the wave reflected by the moving object as detected by a detector at rest near the source?
16-7 Doppler Effect All four equations for the Doppler effect can be combined into one; you just have to keep track of the signs!
16-9 Applications: Sonar, Ultrasound, and Medical Imaging Sonar is used to locate objects underwater by measuring the time it takes a sound pulse to reflect back to the receiver. Similar techniques can be used to learn about the internal structure of the Earth. Sonar usually uses ultrasound waves, as the shorter wavelengths are less likely to be diffracted by obstacles.
16-9 Applications: Sonar, Ultrasound, and Medical Imaging Ultrasound is also used for medical imaging. Repeated traces are made as the transducer is moved, and a complete picture is built.
16-9 Applications: Sonar, Ultrasound, and Medical Imaging This is an ultrasound image of a human fetus, showing great detail.
Summary of Chapter 16 • Sound is a longitudinal wave in a medium. • The pitch of the sound depends on the frequency. • The loudness of the sound depends on the intensity and also on the sensitivity of the ear. • The strings on stringed instruments produce a fundamental tone whose wavelength is twice the length of the string; there are also various harmonics present.
Summary of Chapter 16 • Wind instruments have a vibrating column of air when played. If the tube is open, the fundamental is twice its length; if it is closed, the fundamental is four times the tube length. • Sound waves exhibit interference; if two sounds are at slightly different frequencies they produce beats. • The Doppler effect is the shift in frequency of a sound due to motion of the source or the observer.