Download
1 / 26
280 likes | 480 Vues
Sequence analysis. June 18, 2008 Learning objectives-Understand the concept of sliding window programs. Understand difference between identity, similarity and homology. Appreciate that proteins can be modular

E N D
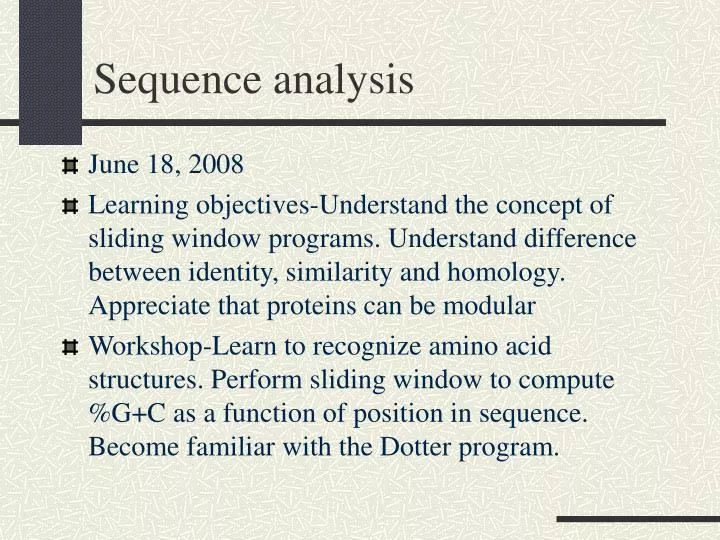
Sequence analysis • June 18, 2008 • Learning objectives-Understand the concept of sliding window programs. Understand difference between identity, similarity and homology. Appreciate that proteins can be modular • Workshop-Learn to recognize amino acid structures. Perform sliding window to compute %G+C as a function of position in sequence. Become familiar with the Dotter program.
4 GCATATGCGCATATCCCGTCAATACCA 5 GCATATGCGCATATCCCGTCAATACCA 6 GCATATGCGCATATCCCGTCAATACCA Sliding window A sliding window-gathers information about properties of nucleotides or amino acids. A simple example is to calculate the %G+C content within a window. Then move the window one nucleotide and repeat the calculation.
Sliding window If the window is too small it is difficult to detect the trend of the measurement. If too large you could miss meaningful data. Small window size %G+C Sequence number Large window size %G+C Sequence number
A T G C C T A G * * A T G C C T A G * * * * * * * * * * * * * * Dot Plot with window = 1 Window = 1 Note that 25% of the table will be filled due to random chance. 1 in 4 chance at each position
Dot Plot with window = 3 A T G C C T A G Window = 3 The larger the window the more noise can be filtered What is the percent chance that you will receive a match randomly? One in (four)3chance. (¼)3 * 100 = 1.56% { A T G C C T A G * * * * * *
Complex folding patterns- Interactions between polypeptides Four levels of protein structure Linear sequence-AGHIPLLQ 1) Primary 2) Secondary 3) Tertiary 4) Quaternary Initial folding patterns- AGHIPLLQ aaaTTTbb
Chou-Fasman Rules (Mathews, Van Holde, Ahern) Amino Acid -Helix -Sheet Turn Ala 1.29 0.90 0.78 Cys 1.11 0.74 0.80 Leu 1.30 1.02 0.59 Met 1.47 0.97 0.39 Glu 1.44 0.75 1.00 Gln 1.27 0.80 0.97 His 1.22 1.08 0.69 Lys 1.23 0.77 0.96 Val 0.91 1.49 0.47 Ile 0.97 1.45 0.51 Phe 1.07 1.32 0.58 Tyr 0.72 1.25 1.05 Trp 0.99 1.14 0.75 Thr 0.82 1.21 1.03 Gly 0.56 0.92 1.64 Ser 0.82 0.95 1.33 Asp 1.04 0.72 1.41 Asn 0.90 0.76 1.23 Pro 0.52 0.64 1.91 Arg 0.96 0.99 0.88 Favors -Helix Favors -Sheet Favors Turns
Chou&Fasman structure prediction Chou & Fasman [Biochemistry 13(2):222-245 (1974)]. By studying a number of proteins whose structures were known, they were able to determine stretches of amino acids that could serve to form an a-helix or a b-sheet. These amino acids are called helix formers or sheet formers and can have different strengths for forming their structures. Once these nucleation sites are determined, adjacent amino acids are examined to see if the structure can be extended in either or both directions. Values for some amino acids allow extension, other amino acids do not. Some amino acids are categorized as helix breakers, or sheet breakers. A string of these will terminate the current structure. This method is about 60-65% accurate.
5 7 4 6 1 2 3 Kyte-Doolittle Hydropathy – Another sliding window routine [J. Mol. Biol. 157:105-132 (1982)]. They determine a "hydropathy scale" for each amino acid based on empirical observations.
Evolutionary Basis of Sequence Alignment 1. Identity: Quantity that describes how much two sequences are alike in the strictest terms. 2. Similarity: Quantity that relates how much two amino acid sequences are alike. 3. Homology: a conclusion drawn from data suggesting that two genes share a common evolutionary history.
Purpose of finding differences and similarities of amino acids in two proteins. • Infer structural information • Infer functional information • Infer evolutionary relationships
One is mouse trypsin and the other is crayfish trypsin. They are homologous proteins. The sequences share 41% identity.
Modular nature of proteins • Proteins possess local regions of similarity. • Proteins can be thought of as assemblies of modular domains.
Modular nature of proteins (cont. 1) Exon 1a Exon 2a Gene A Duplication of Exon 2a Exon 1a Gene A Exon 2a Exon 2a Exchange with Gene B Exon 1b Gene B Exon 2b Exon 2b Exon 3 (Exon 2b from Gene B) Exon 2a Exon 1a Gene A Exon 1b Exon 3 (Exon 2a from Gene A) Gene B Exon 2b
Identity Matrix A 1 C 0 1 I 0 0 1 L 0 0 0 1 A C I L Simplest type of scoring matrix
Similarity It is easy to score if an amino acid is identical to another (the score is 1 if identical and 0 if not). However, it is not easy to give a score for amino acids that are somewhat similar. CO2- CO2- +NH3 +NH3 Isoleucine Leucine Should they get a 0 (non-identical) or a 1 (identical) or Something in between?
Two proteins that are similar in certain regions Tissue plasminogen activator (PLAT) Coagulation factor 12 (F12).
The Dotter Program • Program consists of three components: • Sliding window • A table that gives a score for each amino acid match • A graph that converts the score to a dot of certain density • (the higher the dot density the higher the score)
Single region on F12 is similar to two regions on PLAT Region of similarity