Download
1 / 40
400 likes | 503 Vues
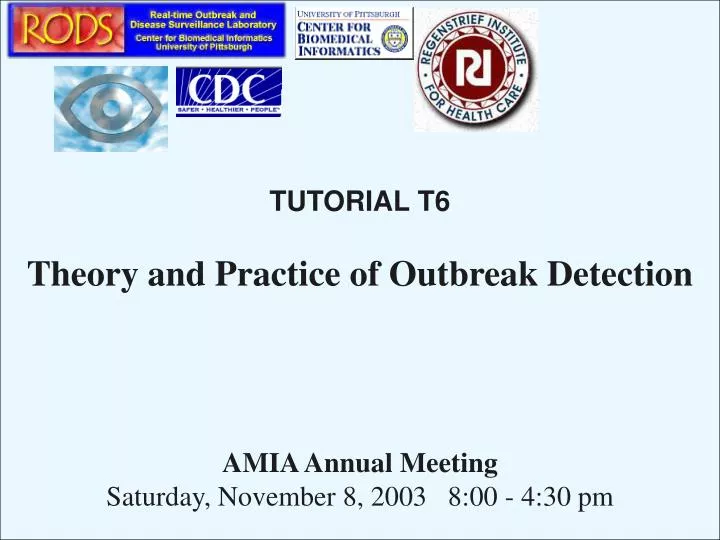
TUTORIAL T6 Theory and Practice of Outbreak Detection. AMIA Annual Meeting Saturday, November 8, 2003 8:00 - 4:30 pm. The Instructors. Andrew Moore. Mike Wagner. John Loonsk Bill Hogan. Marc Overhage. Schedule. I. BACKGROUND (Wagner) 30 minutes II. DATA (Wagner) 1 hour

E N D
TUTORIAL T6 Theory and Practice of Outbreak Detection AMIA Annual MeetingSaturday, November 8, 2003 8:00 - 4:30 pm
The Instructors Andrew Moore Mike Wagner John Loonsk Bill Hogan Marc Overhage
Schedule I. BACKGROUND (Wagner) 30 minutes II. DATA (Wagner) 1 hour -BREAK- III. ALGORITHMS (Moore) 1.5 hours (spans the lunch break) -LUNCH- IIIb. ALGORITHMS CONTINUED (Hogan) .5 hours IV IMPLEMENTATIONS (Overhage) -BREAK- FUTURISTIC PANEL V. CDC IMPLEMENTATIONS (Loonsk) VI Wrap up
THINGS HAVE REALLY CHANGED: Defend the borders by checking everyone’s temperature August 24, 2003 Taipei
Defend the hospital by checking everyone’s temperature and symptoms at the front door August 24, 2003 Taipei
Medical Computer Scientist (aka Medical Informatician) Medical Informatics System Being Demo’d Computer Scientist February 5, 2002
Public Health Law – Wisconsin and Utah Wisconsin Act 109 a pharmacist or pharmacy shall report: • An unusual increase in the number of prescriptions dispensed or nonprescription drug products sold for the treatment of medical conditions specified by DHFS by rule. • An unusual increase in the number of prescriptionsdispensed that are antibiotic drugs. • The dispensing of a prescription for the treatment of a disease that is relatively uncommon or may be associated with bioterrorism Utah Act 26-23b-105. A pharmacist shall report: • an unusual increase in the number of prescriptions filled for antimicrobials; • any prescription that treats a disease that has bioterrorism potential if that prescription is unusual or in excess of the expected frequency; and • an unusual increase in the number of requests for information about or sales of over-the-counter pharmaceuticals … Michigan too!
Scope • “Medical informatics is 90% sociology 10% technology” (Al Pryor, LDS Hospital HELP system pioneer) • Real-time outbreak detection is also 90% sociology 10% technology Good news: we can adequately cover the 10% technical part in 6 hours! I will give 5 minute on the other 90% at the very end!
I am Drawing from Several Reports • Nation’s Current Capacity (Dato, Wagner et al. 2001 88 pages. • Representative Threats for Research in Outbreak Detection (Wagner, Dato et al. 2003) • Emerging Science of Very Early Detection of Disease Outbreaks (Wagner et al. 2001) • How Outbreaks are Detected in US (Dato, Wagner, Fahoudar 2003) (see www.health.pitt.edu/rods/publications.htm )
Very Selective, Myopic, and Brief History of Public Health Surveillance • Public health practice dates to the Greeks • 1800s John Snow used mapping of cases to identify cause of cholera outbreak in London • ~1950 Digital computer invented. • ~1999 concerns about emerging diseases and bioterrorism sparked research and system building designed to exploit potential of information technology
Basic Concepts and Working Definitions • Outbreak: anomalous density of cases • Detection:Noticingthe existence of an anomaly • E.g., one case of very unusual illness • E.g., more sick people than usual • Detection:Characterizing it • Which pathogen • Source • Scope (people, animals) • Environmental scope • Route of transmission … • Response: E.g. quarantine, treatment,
There are a lot of organisms. Which one to start doing research with?
Our Starting Point--Anthrax Scenario WHAT IF … • 100,000 people are exposed • Onset of illnesses occurs over days 1-7 • The costs are • Treatment of sick • Prophylaxis of healthy (exposed and unexposed) • Future earnings lost through deaths, valued at approximately $790,000 per • Mass treatment occurs on days 0, 1, 2, 3, 4, 5, 6 or 7… and it has 90% efficacy Worst case Best case Kaufmann, The economic impact of a bioterrorist attack: Are prevention and postattack intervention programs justifiableEID3(2):83-94, 1997.
6. Autopsy-based diagnosis Presentation to physician Symptoms Deaths 1. Intel 4. Few cases with x-ray findings and gram stains 5. Culture-based diagnosis of 1 case 2. Biosensors 3. Scores of sick people in downwind distribution If Public Health Surveillance Were Implemented Like Missile Defense Release TIME 5 days Teich, Wagner et al, JAMIA 9(1), 2002
What Might Instrumenting the Community Look Like? Clinical Pre Clinical Behavior Animal PBMs OTC Electrolytes Vets Orders for tests OTC Eqpt Zoos Poison Cntrs OTC Meds Animal Cntl 911 Calls Absenteeism Agribusiness Utility use EMS Runs Phone traffic ED Visit Chief Complaints Web Queries Radiograph reports Microbiology Calls to triage center Sentinel MD Diagnoses Cultures Coroner Health dpt. ecords
Astute clinician A notices but forgets to fill out disease reporting form Surface mail If Missile Defense Were Implemented Like Public Health Surveillance … Missile Launch Missile Impact TIME 25 Minutes Astute clinician B notices and fills out disease reporting form the next day
Anthrax Approach What we do now for Anthrax Chief Complaint Chief Complaint Chief Complaint Chief Complaint Chief Complaint Chief Complaint Chief Complaint RespiratorySyndrome RespiratorySyndrome RespiratorySyndrome RespiratorySyndrome RespiratorySyndrome RespiratorySyndrome RespiratorySyndrome • Spatial and temporal analysis to detect overdensity of cases in a zip code or larger region
Detection-Response Coupling DETECTION Release P=0.0001 P=.05 P=0.01 | RESPONSE Mobilize NPS Mobilize Pittsburgh Pharmaceutical Stockpile Ask Poison Center to collect data
Analysis/Characterization -Is it an emergency? -Quarantine? -Get more antibiotics? RESPONSES Additional data collection -”shoeleather” -microchip testing -decision support at the point-of-care Biosurveillance 2005: Maximally accelerated detection-response cycle First Hint of Trouble -statistical analysis of data -astute observer -definitive diagnosis of new or “terrorism” organism
Which Organisms? Contagious person-to-person aerosol: rubella, zoster Premonitory release: Boca Anthrax Foodborne: Salmonella sp. Waterborne: Cryptosporidium Vectorborne:West Nile, Malaria, Lyme Continuous release of bioaerosol: Legionella, pollen Building contamination: CO Sexually transmitted: HIV, N. gonorrhea, Hep C Large scale bioaerosol : NO OUTBREAKS Dato, Wagner, et al. 2001 The Nation's Current Capacity for the Early Detection of Public Health Threats including Bioterrorism. June 8, 2001.
Method to Create Categories (pseudocode) • Assemble exhaustive list of pathogens • For each pathogen (loop) • Four experts (adult ID, Ped ID, WMD/ED, Medical Informatics) identified the spectrum of outbreak size, routes of transmission, indoor outdoor • Refer to each as a ‘threat’ • For each threat (loop) • Experts asked what kind of automated detection system would be needed to detect each threat. • IF the detection system involved DIFFERENT data and algorithm create a new category ELSE add the threat to an existing category • end
List of Detection Problems • Large scale bioaerosol (e.g., Anthrax) • Communicable (e.g., SARS) • Waterborne • Building contamination • Foodborne • Vector borne • Continuous release • Single case • Sexual/blood borne
Two Key Patterns of Concern for Detection 4 5 3 6 Symptoms Presentation to physician Deaths 3 4 5 6 3 = ‘symptoms + pattern’ 4 = ‘nearly pathognomic’ 5 = culture 6 = autopsy Anthrax or other bioaerosol, food contamination, water contamination Contagious disease like Smallpox Early warning system that collects unorthodox, nonspecific data and looks for anomalous patterns Embedded diagnostic expert systems at the point of care, probably requires POE Wagner, Dato et al. Data Required for an Effective Bioterrorism Detection System. Report to AHRQ, 11/28/01 180 pp.
Detecting SARS- Current “Syndromic” Approaches Fever screening: Airports, Building entrance, Hospitals, Schools Testing every sixth Influenza-like illness ???others
Decision Support at Point of Care • Pretty obvious that it will be needed to do better at detecting small outbreaks of unusual diseases early • We already know that it is going to take a long time and a lot of money to get there
Other SARS “Syndromic” Strategy—(A stretch!( • Try to monitor for the SARS syndrome automatically (SARS is a syndrome, after all) • Fever • Respiratory symptoms • Exposure • Pneumonia • Use spatial and other data to try to detect small clusters • In a building • On a hospital floor • In a household or family • In a workplace • …
SARS Respiratory symptom Travel to Asia Fever PositiveChest x-ray Individual SARS Case Detection 1. Cough or other respiratory symptom 2. Temperature > 38 C 3. Chest x-ray showing pneumonia or ARDS 4. High risk of exposure
1. Respiratory symptom • NLP of chief complaints to identify patients with respiratory syndrome • Sensitivity = 0.77 • Specificity = 0.90 • Working on NLP of emergency department reports • Less timely (~1 day after admission) • But expect better sensitivity/specificity
How Well Can We Detect Respiratory Case? Courtesy Per Gesteland, MD
2. Temperature or fever • Coded temperature (Possibly best, but minority of hospitals and temperature may be normal in a patient with rigors) • From NLP of chief complaints • By NLP of Emergency Department (ED) dictation • Sensitivity = 0.98 • Specificity = 0.89 • ~1 day delay
Detection of Chest x-ray reports consistent with pneumonia Sym-Text KS P-KS Sensitivity 0.95 0.87 0.85 Specificity 0.85 0.70 0.96 PVP 0.78 0.77 0.83 NPV 0.96 3. Pneumonia on CXR • Previous experience with NLP system SymText successful • Keyword search is a reasonable alternative
4. Risk of Exposure • Feasible to obtain on say Air force base • Less feasible in civilian community but… • Workplace, especially hospital floords • School • Buildings • First three data sources may be sufficient • Human review of probable SARS cases • ED reports/ H&P exams • Contact patients
How we are trying to extend it for SARS Chief Complaint Chief Complaint Chief Complaint Chest radiograph Other data Chest radiograph Other data Chest radiograph Other data Temperature Temperature Temperature SARSSyndrome SARSSyndrome SARSSyndrome • Spatial, temporal, and other clustering analysis to detect overdensity of cases • In a building, on a hospital floor, in a household or family, in a workplace • (e.g., a mail handling facility) Unifying Anthrax and SARS Approach What we do now for Anthrax Chief Complaint Chief Complaint Chief Complaint Chief Complaint Chief Complaint Chief Complaint Chief Complaint RespiratorySyndrome RespiratorySyndrome RespiratorySyndrome RespiratorySyndrome RespiratorySyndrome RespiratorySyndrome RespiratorySyndrome • Spatial and temporal analysis to detect overdensity of cases in a zip code or larger region
DATA: Which Data Sources are Useful (available and have an early signal)? 1999 Influenza Influenza cultures Sentinel physicians WebMD queries about ‘cough’ etc. School absenteeism Sales of cough and cold meds Sales of cough syrup ER respiratory complaints ER ‘viral’ complaints Influenza-related deaths Week (1999-2000)
ALGORITHMS: Which Algorithms Can Extract Maximum Information from the Data? You will hear about it this from Drs. Moore, and Hogan
Health Care System 1 Health System 2 Hosp 1 Hosp 1 Message router Message router Hosp 2 Hosp 2 Hosp 3 Hosp 3 Hosp N Hosp N Systems: The really hard part National Retail Data Monitor Detection algorithm Detection algorithms RODS DB • Heavily dependent on existing infrastructure • Hospitals, Retail industry • Internet • Heavily dependent on standardization • of Architecture, Security • of data, messages Web HL7 Listeners Naive Bayes DB VPN GIS