Download
1 / 11
110 likes | 368 Vues
. 1.Introduction. . . . . . . . . . . Fe. Si. . . b-FeSi2 crystal structure. Modified CaF2 structurea=98.63, b=77.91, c=78.33 nm. Epitaxial growth on Si substrate.. b-FeSi2. A thermoelectric material reported as 0.85eV energy band-gap.. Highly optical absorption coefficient a(hn) larger than 1.0x105 cm-1 at 1.0eV..

E N D
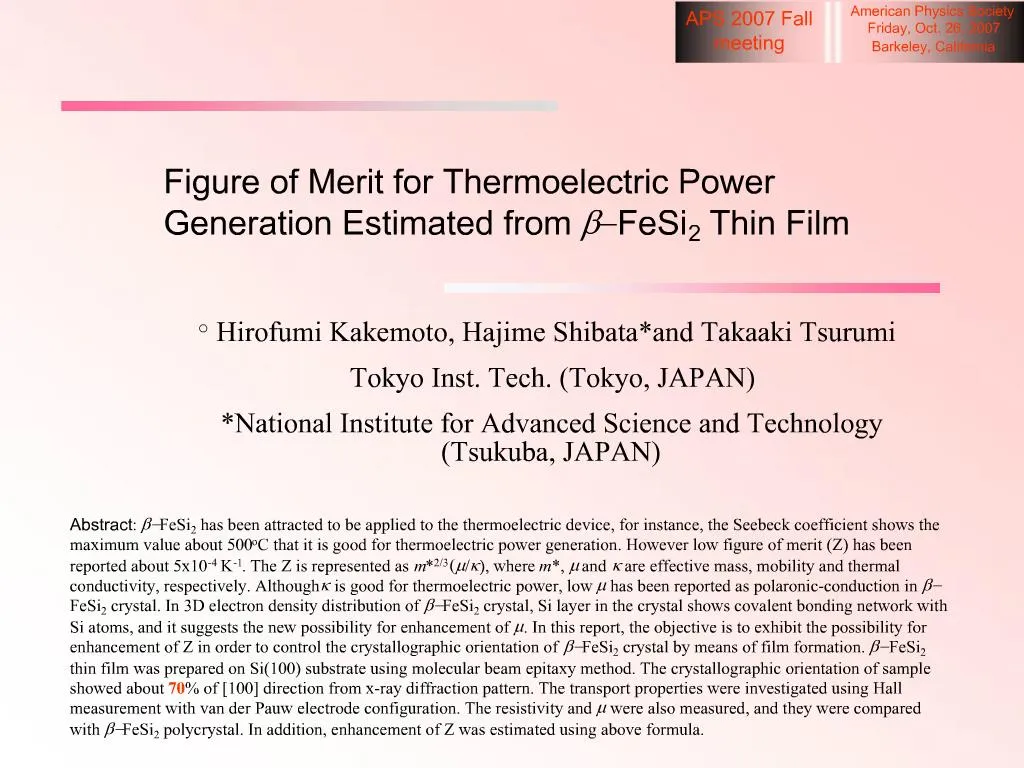
1. Figure of Merit for Thermoelectric Power Generation Estimated from b-FeSi2 Thin Film Thank you chair man, Good morning!
My name is Hirofumi Kakemoto come from Tokyo institute of Technology,Tokyo, Japan
The presentation is entitled �Figure of merit for thermoelectric power generation estimated from b-FeSi2 thin film�Thank you chair man, Good morning!
My name is Hirofumi Kakemoto come from Tokyo institute of Technology,Tokyo, Japan
The presentation is entitled �Figure of merit for thermoelectric power generation estimated from b-FeSi2 thin film�
2. 1.Introduction At first, Introduction
Beta-FeSi2 is a modified CaF2 structure, and has three times bigger primitive cell as shown lattice constants
Beta-FeSi2 is a thermoelectric material showing of 0.85eV energy band-gap.
Recently, high optical absorption coefficient that is larger than 1.0x10^5 cm^-1 at 1.0eV has been reported.
Epitaxial growth on Si substrate.
Thermoelectric property is well known from polycrystal.
Seeback coefficient shows maximum value at 500oC, it is good temperature dependence for thermoelectronics.
However, efficiency is not good.
So, strong-Urbach-tail is difficult to discuss the nature of band-gap.
********************************************
????????????
Beta-FeSi2?x???
Seeback????x???
Figure of merit??x???
??????
At first, Introduction
Beta-FeSi2 is a modified CaF2 structure, and has three times bigger primitive cell as shown lattice constants
Beta-FeSi2 is a thermoelectric material showing of 0.85eV energy band-gap.
Recently, high optical absorption coefficient that is larger than 1.0x10^5 cm^-1 at 1.0eV has been reported.
Epitaxial growth on Si substrate.
Thermoelectric property is well known from polycrystal.
Seeback coefficient shows maximum value at 500oC, it is good temperature dependence for thermoelectronics.
However, efficiency is not good.
So, strong-Urbach-tail is difficult to discuss the nature of band-gap.
********************************************
????????????
Beta-FeSi2?x???
Seeback????x???
Figure of merit??x???
??????
3. Objective in this study So, figure of merit, thermoelectric generation, can be represented as Z=xxx or xxx.
This is other representation as B factor.
We can say, that
In this presentation, we focus increasing mobility in this crystal.
So, Objective is ..
Preparation a-axis oriented beta-FeSi2 thin film on Si(100) substrate, and fin the methods for obtaining the optical constants of beta-FeSi2 thin film on Si(100) substrate, and find the methods for obtaining the optical constants of beta-FeSi2 thin film on Si(100) substrate removing the Urbach-tail. In addition, investigate the transport properties of beta-FeSi2 thin film.
*********************************************************************************
????:Figure of merit?x???????
?????????????
??????????????????????????
????
???????
?????So, figure of merit, thermoelectric generation, can be represented as Z=xxx or xxx.
This is other representation as B factor.
We can say, that
In this presentation, we focus increasing mobility in this crystal.
So, Objective is ..
Preparation a-axis oriented beta-FeSi2 thin film on Si(100) substrate, and fin the methods for obtaining the optical constants of beta-FeSi2 thin film on Si(100) substrate, and find the methods for obtaining the optical constants of beta-FeSi2 thin film on Si(100) substrate removing the Urbach-tail. In addition, investigate the transport properties of beta-FeSi2 thin film.
*********************************************************************************
????:Figure of merit?x???????
?????????????
??????????????????????????
????
???????
?????
4. 2.Experimental Next is the Experimental
The samples were prepared by molecular beam epitaxy method.
Actually, the chamber was initially a pulsed laser deposition,
In this study modified as molecular beam epitaxy using an Fe source.
This is Preparation Condition
Substrate was used un-doped Si(100) substrate.
Pressure was : 10^-9 Torr.
Substrate temperature was kept about 500oC
And, then, annealed same temperature for 2 hours
Characterization(s) are
Reflection high energy electron beam diffraction
X-ray diffraction
FTIR and Hall measurementNext is the Experimental
The samples were prepared by molecular beam epitaxy method.
Actually, the chamber was initially a pulsed laser deposition,
In this study modified as molecular beam epitaxy using an Fe source.
This is Preparation Condition
Substrate was used un-doped Si(100) substrate.
Pressure was : 10^-9 Torr.
Substrate temperature was kept about 500oC
And, then, annealed same temperature for 2 hours
Characterization(s) are
Reflection high energy electron beam diffraction
X-ray diffraction
FTIR and Hall measurement
5. 3.Results & Discussion Results and Discussion
First, .. the surface of Si substrate was monitored RHEED (like this)
The surface of Si substrate shows 2x1 pattern.
Epitaxial relation between Si and beta-FeSi2 film is like this.
Firstly, Fe rate, namely, emission current of Fe source was used less than 10mA.
But, crystallinity of sample is not good.
Hence, second, emission current was used larger than 10mA.
Crystallographic orientation is, in this case, defined as..
*******************************************************************
???????
???Si????????????????
Fe????????
Results and Discussion
First, .. the surface of Si substrate was monitored RHEED (like this)
The surface of Si substrate shows 2x1 pattern.
Epitaxial relation between Si and beta-FeSi2 film is like this.
Firstly, Fe rate, namely, emission current of Fe source was used less than 10mA.
But, crystallinity of sample is not good.
Hence, second, emission current was used larger than 10mA.
Crystallographic orientation is, in this case, defined as..
*******************************************************************
???????
???Si????????????????
Fe????????
6. This is the XRD patterns of samples
Before annealing
Fe peaks are apparently observed.
However, adjusting preparation conditions,
Although, 202/220 diffraction peak is strongly ..
[100] oriented beta-FeSi2 peaks
So, 400, 600, 800 peaks are clearly observed.
A partly, we success that orientation of this crystal is controlled by MBE method.
Next we are decided band gap of sample.
One of the sample was provided to FT-IR measurements, and analyzed
, the answer is the Simultaneous Equation (SE) analysis
As mentioned in introduction
In this material, strong Urbach-tail is observed around 0.85eV
Kramer-Kronig transformationThis is the XRD patterns of samples
Before annealing
Fe peaks are apparently observed.
However, adjusting preparation conditions,
Although, 202/220 diffraction peak is strongly ..
[100] oriented beta-FeSi2 peaks
So, 400, 600, 800 peaks are clearly observed.
A partly, we success that orientation of this crystal is controlled by MBE method.
Next we are decided band gap of sample.
One of the sample was provided to FT-IR measurements, and analyzed
, the answer is the Simultaneous Equation (SE) analysis
As mentioned in introduction
In this material, strong Urbach-tail is observed around 0.85eV
Kramer-Kronig transformation
7. Simultaneous Equation analysis This is the schematic illustration of sample.
The boundary conditions are defined like this
Anaysis software is
Igor pro
Mathematica
*******************************************************
????????
???????
???FTIR??????
???????????
This is the schematic illustration of sample.
The boundary conditions are defined like this
Anaysis software is
Igor pro
Mathematica
*******************************************************
????????
???????
???FTIR??????
???????????
8. Reflectance and transmittance spectra of sample (oriented film) Reflectance and transmittance spectra of sample
These are reflectance and transmittance data of Si substrate and sample.
The onsets are clearly observed in transmittance spectra. (like this)
At first, extinction coefficient of transmittance data only is calculated as shown in Exp..
Strong Urbach-tail is shown around band-edge..
On the other hand, simultaneous equation analysis was carried out for sample.
The Urbach tail is removed, and abrupt extinction coefficient is calculated using SE analysis.
**************************************************************
??????????????
??????????????????????
??????Reflectance and transmittance spectra of sample
These are reflectance and transmittance data of Si substrate and sample.
The onsets are clearly observed in transmittance spectra. (like this)
At first, extinction coefficient of transmittance data only is calculated as shown in Exp..
Strong Urbach-tail is shown around band-edge..
On the other hand, simultaneous equation analysis was carried out for sample.
The Urbach tail is removed, and abrupt extinction coefficient is calculated using SE analysis.
**************************************************************
??????????????
??????????????????????
??????
9. Predicted properties
10. Hall measurement The Hall measurement was carried out using Van der Pauw method.
Hole mobility of samples is increased with increasing orientation of sample.
Figure of merit of sample is represented as Z=xx
So this is B-factor representation, these parameters are independent parameters.
The Hall measurement was carried out using Van der Pauw method.
Hole mobility of samples is increased with increasing orientation of sample.
Figure of merit of sample is represented as Z=xx
So this is B-factor representation, these parameters are independent parameters.
11. 4.Summary Summary of this presentation
Is like this
And
Future study is
1
2
3
N
Summary of this presentation
Is like this
And
Future study is
1
2
3
N
12. Future Study