Download
1 / 19
190 likes | 328 Vues
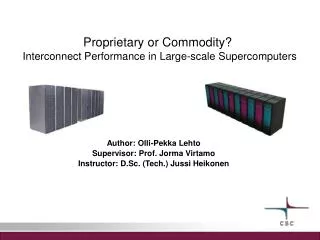
Making the Technology Choice: Commodity vs Proprietary. Outline. Baseline study characteristics, architecture and methodology Analysis methodology Baseline 802.11b results Sensitivity studies from 802.11b baseline – “The 4 Cs” Coverage Capacity CPE Cost Competition (market share)

E N D
Outline • Baseline study characteristics, architecture and methodology • Analysis methodology • Baseline 802.11b results • Sensitivity studies from 802.11b baseline – “The 4 Cs” • Coverage • Capacity • CPE Cost • Competition (market share) • Technology variants • Additional services • Break-even results • Conclusions
Baseline Study Characteristics • Geographic Areas • 100K population with 2% annual growth • 50 mi2 suburban, 2000 mi2 rural • Market Size and Growth • Fisher-Pry (S-shaped) market growth, with 50% eventual market penetration and 5 year growth to 25% penetration • 25% market share, 10% churn per year • Browsing Service • 1 Mbps asynchronous 5% duty down, 1% duty up • $35 per month 5 sessions/hr 100 seconds each • IP Voice Service • 16 kbps, no voice activity detection • $10 per month 3 calls/hr 180 seconds each • Additional Access Port Site expenses • $20,000 one-time per site • $10,000 per year per site (rental)
ISP CPE AP Router Baseline Architecture & Technology OC3 (155 Mbps) Up to 4 $30,000 + $100/km + OC3 * ($5,000 + $100/mo) 802.11b Wireless Link Avg Throughput 2 Mbps Point-to-Point Wireless 10 Mbps Shared Capacity $10,000 + $100/mo ISP $200/mo for 256 kbps Router 100 Mbps Capacity, 8 Input Ports $10,000 + $100/mo CPE Xmit Pwr = 17 dBm Antenna Gain = 10 dBi $250, $100 connect, $50 Equipment Recovery Access Point Xmit Power = 20 dBm Antenna Gain = 10 dBi $2,000 + $20/mo + Channels * ($500 + $10/mo)
Model Services Model Areas Model Equipment Analysis Methodology • Establish 802.11b Baseline • Investigate Sensitivity to: • Path Loss • Capacity • CPE Cost • Market Share • How about 5.8 GHz? Other technologies? • Add IP Voice? Build for Coverage Expand for Capacity Size and Cost Equipment Generate Business Case Metrics Create Summary Graphs As a function of time Calculations performed using WirelessSWAT for WISPs
Baseline 802.11b Financial Results - Rural • Large initial capital investment required due to low subscriber density – • coverage-limited deployment • No further capital required for 8 years • ROI = 21.2%, NPV of EBITDA = $2.69M
Baseline 802.11b Study Results - Suburban • More incremental capital investment as deployment becomes • capacity-limited • Significantly lower early capital investment than for rural deployment • ROI = 54.7%, NPV of EBITDA = $5.43M
Baseline 802.11b Study ResultsRisk vs Reward • Rural deployment is coverage-limited during most of study, • so takes longer to break even • Same overall capital investment – both deployments serve the • same market size and both are eventually capacity-limited • Break-even period = 5.6 years for suburban, 8.9 years for rural
802.11b 2.4 GHz Baseline ROI & NPV vs Excess Path Loss (Coverage) suburban rural • Suburban deployment is capacity-limited, rural deployment is • coverage-limited except at low excess path loss values • Successful rural deployment requires relatively unobstructed paths • Suburban ROI is relatively insensitive to excess path loss • ROI and NPV yield equivalent qualitative conclusions
802.11b 2.4 GHz Baseline ROI & NPV vs Sectors/Access Point (Capacity) suburban rural • Increased capacity at an Access Point is useful in suburban • deployments, but not in rural deployments • Note: 3 or more sectors per Access point not practical at 2.4 GHz, • due to insufficient spectrum
802.11b 2.4 GHz Baseline ROI vs CPE Cost • Increased CPE cost is a significant contributor to reduced ROI • in all deployments
802.11b 2.4 GHz Baseline ROI vs Purchased Link Margin suburban rural • CPE cost spent on additional link margin is detrimental in the • capacity-limited suburban environment • ROI is maximized in rural deployments by moderate additional • CPE cost to improve link margin (here around $75)
802.11b 2.4 GHz Baseline ROI vs Market Share (Competition) suburban rural • Increased market share in suburban deployments increases absolute • returns, but does not significantly increase ROI • Increased market share in rural deployments significantly increases • both absolute returns and ROI • Use of 2 sectors per Access Point significantly increases ROI • except in rural deployments with low market share
General 802.11b Financial Trends • Excess path loss is more detrimental in rural deployments • Additional capacity at an Access Point is more useful in suburban deployments • CPE cost is a significant component of overall business plan • Moderate CPE expenditure to increase link margin is beneficial in rural deployments, but detrimental in suburban deployments • Increased market share improves ROI only in rural environments
802.11b at 5.8 GHzROI vs Sectors/Access Point • Additional link margin has negative benefit in suburban deployments • (capacity-limited design is unchanged, but costs increase) • 5.8 GHz slightly inferior to 2.4 GHz unless additional capacity per • Access Point is needed
High-Capacity 5.8 GHz TDD TechnologyROI vs Market Share • 7 Mbps in 10 MHz RF bandwidth +17 dBm transmitter powers • +10 dBi antenna gains 6 sectors per Access Point • Optimized for high subscriber densities • Moderate additional antenna gain can protect against low achieved • market penetration
Data Only Add Voice 140 120 100 80 2012 ROI (%) 60 40 20 Adding Voice-over-IP Services 0
Data + Voice Addl for No Voice 10 9 8 7 6 ROI Break-Even (yrs) 5 4 3 2 1 0 ROI Break-Even Period for Voice + Data & Data Only
Conclusions • The viability of 802.11b depends very much on the density of users to which the service is provided • CPE cost can be a controlling parameter but minimizing it is not always the answer. Moderate expenditure to increase link margin is justified in rural environments • Sectorization is more beneficial in areas with higher subscriber density • Use of 5.8 GHz is acceptable where capacity is needed but range is not • IP voice can be a good plan to obtain additional revenues from unused capacity and to reduce break-even period • Proprietary technologies or 802.11b modifications can help to address market and environment variations • Combined engineering and business case analysis should always be done prior to investing money