Download
1 / 15
150 likes | 334 Vues
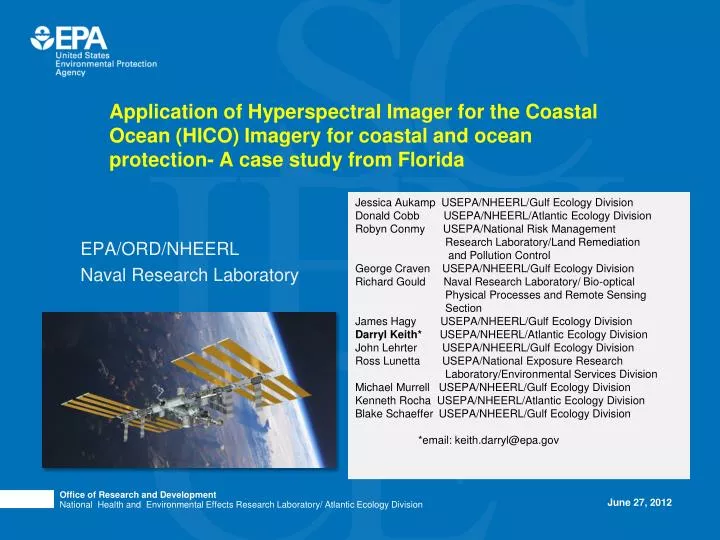
EPA/ORD/NHEERL Naval Research Laboratory. Application of Hyperspectral Imager for the Coastal Ocean (HICO) Imagery for coastal and ocean protection- A case study from Florida. Jessica Aukamp USEPA/NHEERL/Gulf Ecology Division Donald Cobb USEPA/NHEERL/Atlantic Ecology Division

E N D
EPA/ORD/NHEERL Naval Research Laboratory Application of Hyperspectral Imager for the Coastal Ocean (HICO) Imagery for coastal and ocean protection- A case study from Florida Jessica Aukamp USEPA/NHEERL/Gulf Ecology Division Donald Cobb USEPA/NHEERL/Atlantic Ecology Division Robyn Conmy USEPA/National Risk Management Research Laboratory/Land Remediation and Pollution Control George Craven USEPA/NHEERL/Gulf Ecology Division Richard Gould Naval Research Laboratory/ Bio-optical Physical Processes and Remote Sensing Section James Hagy USEPA/NHEERL/Gulf Ecology Division Darryl Keith* USEPA/NHEERL/Atlantic Ecology Division John LehrterUSEPA/NHEERL/Gulf Ecology Division Ross LunettaUSEPA/National Exposure Research Laboratory/Environmental Services Division Michael Murrell USEPA/NHEERL/Gulf Ecology Division Kenneth Rocha USEPA/NHEERL/Atlantic Ecology Division Blake Schaeffer USEPA/NHEERL/Gulf Ecology Division *email: keith.darryl@epa.gov
The U.S. Environmental Protection Agency’s mandate to protect human health and the environment requires innovative and sustainable solutions for addressing the Nation’s environmental problems. HICO offers EPA and the environmental monitoring community an unprecedented opportunity to observe changes in coastal and estuarine water quality across a range of spatial and temporal scales not possible with field-based monitoring.
Program objectives Use HICO imagery to develop a novel space-based environmental monitoring system that provides information for the sustainable management of coastal ecosystems. Provide the foundation for a technology which EPA Regional Offices and Office of Water can use to report water quality conditions nationwide through media outlets and Smartphone applications. Water quality news reports will change the social and economic dynamics for the Nation to not only be aware of its water quality conditions but support sustainable practices to improve those conditions.
Hyperspectral Imager for the Coastal Ocean (HICO) • Sponsored as an Innovative Naval Prototype (INP) of Office of Naval Research • January 2007: HICO selected to fly on the International Space Station (ISS) • November, 2007: construction began following the Critical Design Review • August, 2008: sensor integration completed • April, 2009: shipped to Japan Aerospace Exploration Agency (JAXA) for launch • September 10, 2009: HICO launched on JAXA H-II Transfer Vehicle (HTV) • September 24, 2009: HICO installed on ISS Japanese Module Exposed Facility • HICO sensor • is first spaceborne imaging spectrometer designed to sample coastal oceans • samples coastal regions at 100 m (380 to 1000 nm: at 5.7 nm bandwidth) • has high signal-to-noise ratio to resolve the complexity of the coastal ocean Left,HICO, before integration into HREP. Rightred arrow shows location of HREP on the JEM-EF. HICO is integrated and flown under the direction of DoD’s Space Test Program Arnone et al., (2009) HICO for NASA Gulf Workshop
HICO docked at ISS spectrometer & camera HICO in static mode Arnone et al., (2009) HICO for NASA Gulf Workshop HICO Viewing Slit
Parameter Performance Rationale Spectral Range 380 to 960 nm All water-penetrating wavelengths plus Near Infrared for atmospheric correction Spectral Channel Width 5.7 nm Sufficient to resolve spectral features Number of Spectral Channels ~100 Derived from Spectral Range and Spectral Channel Width Signal-to-Noise Ratio for water-penetrating wavelengths > 200 to 1 for 5% albedo scene (10 nm spectral binning) Provides adequate Signal to Noise Ratio after atmospheric removal Polarization Sensitivity < 5% Sensor response to be insensitive to polarization of light from scene Ground Sample Distance at Nadir ~100 meters Adequate for scale of selected coastal ocean features Scene Size ~50 x 200 km Large enough to capture the scale of coastal dynamics Cross-track pointing +45 to -30 deg To increase scene access frequency Scenes per orbit 1 maximum Data volume and transmission constraints Arnone et al., (2009) HICO for NASA Gulf Workshop
Program Implementation Collected HICO images from 2010-2012 from coastal and estuarine waters along northeastern Gulf of Mexico (specifically NW Florida) Collected in situ hyperspectraldata and water quality samples from these waters concurrent with ISS overflights via autonomous underwater vehicles and small boat surveys Choctowhatchee Bay Pensacola Bay St. Andrew Bay St. Joseph Bay
Optical Components of a Coastal Scene Multiple light paths • Scattering due to: • atmosphere • aerosols • water surface • suspended particles • bottom • Absorption due to: • atmosphere • aerosols • suspended particles • dissolved matter
Step 1 Open HICO Level 1b Image with calibrated TOA at-sensor radiances HICO Image Processing Step 2 Recover true at-sensor radiance values Step 3 Sun glint correction Step 4 Offshore pixel subtraction Step 5 Convert from W/m2/um/sr to uW/cm2/nm/sr Determine Mean Solar Irradiance (F0) Step 6 Convert at-sensor Radiance to Reflectance Determine diffuse transmittance from sun to pixel (t0) Step 7 Convert at-sensor Radiance to Remote sensing Reflectance Create GLT + Geolocated + Warped Images Steps 8 - 9 Cloud removal (if needed) Clip estuary shapefile to Warped image Step 10 Export clipped Rrs data to EXCEL Step 11 Turbidity CDOM Processing done with Excelis VIS ENVI 4.7 software TSM Chla
iss2012016.0116.193730.L1B_PensacolaBay_des.v03.9170.20120117211554.100m.hico.biliss2012016.0116.193730.L1B_PensacolaBay_des.v03.9170.20120117211554.100m.hico.bil Step 1: Level 1b calibrated radiance Step 3:Seabed corrected radiance (W/m2/um/sr) Step 5:Offshore pixel subtraction (W/m2/um/sr) Step 7: Remotely sensed Reflectance (1/sr)
Conclusions 49 HICO images covering the period March 2010 – May 2012 from four estuaries along the Florida Panhandle area have been processed for chlorophyll a concentration and colored dissolved organic matter absorption (CDOM) using algorithms developed from in situ spectral and water data. To date, the regional and local distribution of chlorophyll a and CDOM absorption in these images have been field validated and are statistically significant. Future activities will include field validation of algorithms for water clarity, suspended sediments concentration, light attenuation and salinity. The HICO-derived water quality data have been uploaded to a internal EPA HICO website for review and use by the EPA Office of Water. A prototype mobile application has been completed.