Download
1 / 24
240 likes | 360 Vues
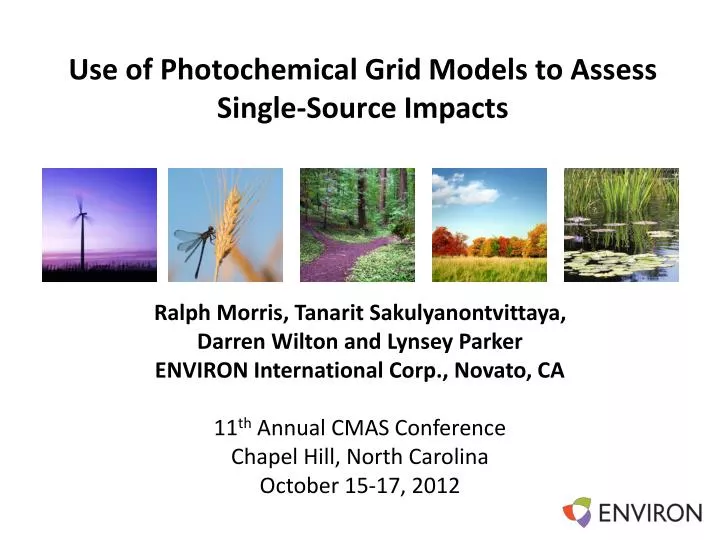
Use of Photochemical Grid Models to Assess Single-Source Impacts. Ralph Morris, Tanarit Sakulyanontvittaya, Darren Wilton and Lynsey Parker ENVIRON International Corp., Novato, CA 11 th Annual CMAS Conference Chapel Hill, North Carolina October 15-17, 2012. Background.

E N D
Use of Photochemical Grid Models to Assess Single-Source Impacts Ralph Morris, Tanarit Sakulyanontvittaya, Darren Wilton and Lynsey Parker ENVIRON International Corp., Novato, CA 11th Annual CMAS Conference Chapel Hill, North Carolina October 15-17, 2012
Background • Long Range Transport (LRT) models estimate incremental air quality (AQ) concentration and related values (AQRV) at Class I areas for distances > 50 km • e.g., PSD, BART and NEPA • AQRVs include visibility and acid deposition (S and N) • 1998 Interagency Workgroup on Air Quality Modeling (IWAQM) • Recommends CALPUFF for far-field Class I assessments • 2003 EPA modeling guidance • Recommends CALPUFF for far-field air quality assessments of inert pollutants • Secondary PM2.5 is important for far-field AQ/RV • But CALPUFF not an EPA-preferred model for secondary PM2.5
Background • 2009 EPA/IWAQM Phase II Reassessment Report • Addresses lack of recommended settings for regulatory applications of CALMET/CALPUFF • “Anything goes” – options set to achieve desired result • Recommended CALMET options to “pass through” WRF/MM5 meteorology to CALPUFF • August 2009 EPA Clarification Memo • New recommended CALMET settings • EPA has developed the MesoscaleModel Interface Tool (MMIF) • Pass through WRF/MM5 meteorology to CALPUFF as much as possible
Background • EPA is examining alternative LRT models for far-field AQ/RV issues • Considering photochemical grid models (PGMs) • PGM reluctance in the past: • Bigger/complex databases, higher computational requirements • Multiple model runs (zero-out run for single source) • More modeling expertise to use • Grid resolution issues (e.g., miss max plume concentrations) • Overriding considerations: • Treats ozone – a pollutant of increasing importance • Contains state-of-science gas/PM chemistry • Currently used for NEPA single-source assessments
Purpose • Perform single-source Class I AQ/RV demonstration for example test sources • Use a PGM, compare results to CALPUFF • Maximum PSD pollutant concentrations • Maximum visibility impacts • Maximum annual sulfur and nitrogen deposition
Overview of Approach • Select 2 existing western PGM/MM5 databases • 2005 4 km Four Corners Air Quality Task Force (FCAQTF) • 2006 12 km Utah-Colorado (UT-CO) • Select existing test sources • Electrical Generating Units (EGUs) of various sizes (point source) • Oil and Gas production sources (point and area) • Model single-source AQ/RV impacts at Class I areas using multiple models/configurations • CAMx PGM • CALPUFF V5.8 • CALMET and MMIF meteorological inputs
Modeling Differences • CALPUFF Gaussian puff formulation • Class I areas represented by hundreds of receptors • Touted as resolving higher peak plume concentrations • Is this really true at longer downwind distances? • POSTUTIL (NO3 repartitioning) not used in these analyses • CAMxEulerian grid formulation • Resolves AQ/RV impacts at grid resolution • 12 and 4 km in these applications • Does this under estimate maximum impacts? • Plume-in-Grid (PiG) module used to treat early point source plume growth and chemistry • Addresses non-linear resolution-dependent chemistry • Use PM Source Apportionment Technology (PSAT) to track contributions from single sources • Alleviates multiple zero-out runs
2005 4 km FCAQTF • 5 EGU Point Sources • NOX: 4 – 42,000 TPY • SO2: 0.1 – 12,500 TPY • 9 O&G Gridded Sources • 9 x 9 array of 4 km cells • NOX: 175 – 291,800 TPY • SO2: 0 - 127 TPY
2006 12 km UT-CO • 13 EGU Point Sources • NOX: 13 – 34,700 TPY • SO2: 0 – 17,300 TPY • 11 O&G Gridded Sources • 3 x 3 array of 12 km cells • NOX: 51 – 10,30 TPY • SO2: 0 - 14 TPY 10
Max 24-hour SO2 – 2005 4 km FCAQTF CAMxvs CALPUFF/MIFF CALPUFF/MET vs MIFF CAMxvs CALPUFF/MET
Max 24-hour SO2 – 2006 12 km UT-CO CAMxvs CALPUFF/MIFF CAMxvs CALPUFF/MET CALPUFF/MET vs MIFF CALPUFF/MET: 12 km vs 4 km
Max 24-hour SO2 Summary • 2005 4 km FCAQTF • CAMx > CALPUFF/MET > CALPUFF/MMIF • CAMxis closer to CALPUFF/MET • Surprising – CAMx and CALPUFF/MMIF share same met • CAMxestimated highest annual SO2from FCPP at Mesa Verde NP (~50 km away) • Surprising – grid cells thought to produce lower concentrations than receptors • 2006 12 km UT-CO • CALPUFF/MET ~ CALPUFF/MMIF > CAMx • CAMx grid resolution may play a role • But different year, different/farther source-receptor couples add complexity • CALPUFF/MET 4 km = 12 km
CAMx 2006 12 km UT-CO Annual SO4 from EGU1 CALPUFF/MET CALPUFF/MIFF 14
CAMx 2006 12 km UT-CO Annual PNO3 from EGU1 CALPUFF/MET CALPUFF/MIFF 15
CAMx 2006 12 km UT-CO Annual PM10 from EGU1 CALPUFF/MET CALPUFF/MIFF 16
CAMx 2006 12 km UT-CO Max 24-hour PM10 from EGU1 CALPUFF/MET CALPUFF/MIFF 17
Max 24-hour Visibility – 2005 4 km FCAQTF CAMxvs CALPUFF/MIFF CALPUFF/MET vs MIFF CAMxvs CALPUFF/MET
Max 24-hour Visibility – 2006 12 km UT-CO CAMxvs CALPUFF/MIFF CAMxvs CALPUFF/MET CALPUFF/MET vs MIFF CALPUFF/MET: 12 km vs 4 km
Spatial Variability Across Class I Areas 140 km 45 km 235 km 190 km 225 km 170 km • Spatial variability not always greater in CALPUFF • Little spatial variability > 100 km from the source
Visibility Summary • Used latest IMPROVE equation • Extinction due to SO4, PNO3, EC, OA, Crustal (no NO2) • Monthly average f(RH) values • CALPUFF makes more PNO3than CAMx • Constant 1 ppb background ammonia in CALPUFF • CALPUFF does not account for chemistry of puff overlap • Little spatial variability for distant Class I areas (> 100 km) • 2005 4 km FCAQTF • CALPUFF/MET = 1.4 x CALPUFF/MMIF (40% higher) • CALPUFF/MET = 2.0 x CAMx (100% higher) • 2006 12 km UT-CO • CALPUFF/MET ~ CALPUFF/MMIF > CAMx • CALPUFF/MET 12 km = 4 km
Nitrogen Deposition – 2005 4 km FCAQTF • CAMx = 2.0 x CALPUFF/MET/MMIF • CALPUFF/MET ~ CALPUFF/MMIF • CAMxcarries more NO3 as HNO3 (CALPUFF tends toward PNO3) • HNO3 has higher dry deposition rate • CAMx= ∑ N Species • CALPUFF = NOx + HNO3 + NO3+ NH4
Conclusions • Demonstrate utility of PGM’s for single source AQ/AQRV impacts • Better chemistry, 3-D long-range transport/dispersion • Results for inert/linear pollutants not so different • PGM resolution may play a role at short distances (<100 km) • High receptor density makes no differenceat farther distances • Surprisingly, CAMxmost dissimilar to CALPUFF/MMIF for 2005 gas SO2 concentrations • Visibility/deposition differences arise from HNO3/PNO3 partitioning • HNO3has higher dry deposition rate • More PNO3 largervisibility impact, lower N deposition • Partitioning of NO3 during transport is important • POSTUTIL does not remedy this issue
Acknowledgements Work funded by EPA OAQPS Air Quality Modeling Group under sub-contract to UNC/Institute of the Environment Final report will be posted on SCRAM