Download
1 / 18
180 likes | 352 Vues
QUANTIFYING BOREAL FIRE & POLLUTION ENHANCEMENT OF THE FREE TROPOSPHERIC OZONE COLUMN DURING THE 2008 ARC-IONS CAMPAIGN. Alaina Luzik, Stephan Gallagher, & Anne Thompson Penn State University, Dept of Meteorology. Outline. Introduction to the Laminar Identification (LID) Method Motivation

E N D
QUANTIFYING BOREAL FIRE & POLLUTION ENHANCEMENT OF THE FREE TROPOSPHERIC OZONE COLUMN DURING THE 2008 ARC-IONS CAMPAIGN Alaina Luzik, Stephan Gallagher, & Anne Thompson Penn State University, Dept of Meteorology
Outline • Introduction to the Laminar Identification (LID) Method • Motivation • Fire Regions • Method for Fire Assessment • Results • Conclusion • Future Work
Introduction to the LID Method • Correlation between the normalized ozone profile and potential temperature is plotted up to the tropopause • Strong Correlation > 0.7 is Gravity Wave (green) • Weak Correlation (between -0.3 and 0.3) is Rossby Wave (yellow)
LID Method • Gravity Wave is classified as the Regional Convention and Lightning (RCL) term • Rossby Wave is classified as either Stratospheric (STRAT) influence or Other • “Other” ozone is the unclassified left-overs • Any ozone below 1-2 km (varies at each site) is classified as Boundary Layer (BL) ozone. • BL ozone is ignored for this study
Motivation • ~50 % of the average TTOC is classified as “Other” • How much ozone is due to fires/pollution?
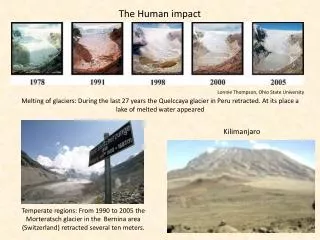
Fire Regions 6 major fire/pollution sources: Siberian Fires Asian Pollution/California Fires Western Canadian Fires Midwestern U.S. Fires Southeastern U.S. Fires Eastern Canadian Fires Western Canadian Fires Eastern Canadian Fires Siberian Fires California Fires Asian Pollution Midwestern U.S. Fires Southeastern U.S. Fires
Determining Layers Using NOAA HYSPLIT • HYSPLIT back trajectories were used to determine low, middle, and upper layers based strictly on directional changes over the past 6 days • Overall, the 3 layers were fairly consistent at each location (across the campaign) Upper Middle Low BL • Example from Boulder, CO (July 3, 2008, levels: red: 4 km, blue: 9 km, green: 12 km) of 3 layers as each direction of back trajectories are substantially different • Ozone, Temperature, and RH profile from July 3, 2008, in Boulder, CO, displaying the 3 layers HYSPLIT: Hybrid Single-Particle Lagrangian Integrated Trajectory (http://www.ready.noaa.gov/ready/open/hysplit4.html)
Ozone Levels in Each Layer • After determining the 3 distinct layers, we computed the ozone levels within each layer using the budgeter program • The LID method is still applied as well to break them into categories • Level and budget breakdown of 3 layers and 4 categories of ozone (DU) from July 3, 2008, in Boulder, CO
Fire Assessment • Use HYSPLIT back trajectories and FIRMS fire maps to determine fire influence in each layer • Boulder, CO: July 3, 2008 • Low (red): no fire influence • Middle/Upper (blue/green): fire influence from California (between San Francisco and Los Angeles)
Comparisons to Averages • Daily fire influence was determined by comparing that day's ozone amount in each category to the respective average ozone within each layer on all fire days • Boulder, CO: July 3, 2008 • Middle: STRAT ozone: 49% increase due to fires • Upper: Other ozone: 90% increase due to fires • All other categories on this day did not increase due to fires on this day (based on the average)
Enhancement Percentages • Averages of each percent increase were determined across all 6 fire/pollution sources (rather than each layer) • Using those percentages, the amount of ozone attributed to fires/pollution was determined and applied to the original budgets 9.9 DU 0.16 DU 9.5 DU 0.24 DU
Methods Summary 1. Collect Data: ground launches of ozonesondes & radiosondes 2. Compute LID Budgets: break ozone into BL, RCL, STRAT, & Other categories 3. Determine Layers: use of HYSPLIT back trajectories to find low, middle, & upper layers 4. Ozone in Layers: compute ozone levels & 4 categories within each layer 5. Fire Assessment: use back trajectories & FIRMS fire maps to determine fire effect 6. Comparisons: amount of ozone on fire days compared to avg within each layer 7. Source Contribution: % of Asian pollution/CA, Siberian, Canadian, & SE US fires assessed 8. Enhancements: % increase due to fires used to re-categorize & modify budgets 9. Final Budget: Break ozone into BL, RCL, STRAT, Fires/ Pollution, & Other
LOCATION VARIABILITY OF FIRE & POLLUTION INFLUENCE • Representation of the relative percentage of fire/pollution influence between locations (by all 5 sources) in all layers, for each day (roughly 15 days of data)
FINAL BUDGET WITH FIRES & POLLUTION • Redistribution of ozone budgets account for ozone enhancement in the RCL, STRAT and Other terms
Results • Fire/Pollution contribution: 22% and 9.1 DU increase in TTOC • Ozone enhancement percentages: • Large enhancement by STRAT was not expected and may indicate an error in the LID methodology
Conclusion • Forest Fires from Siberia as well as North America influenced ozone column amounts at all ARC-IONS sites • Average Enhancement of 9.1 DU (22%) of the TTOC • Improvements to the LID method are necessary to correctly classify STRAT ozone
Future Work • Expand this study to include the IONS-04 and IONS-06 data for sites that were used in all 3 campaigns • Further distinguish between ozone sources classified as “Other”
Acknowledgements • ARC-IONS sponsored by NASA Bibliography • NOAA’s HYSPLIT: Hybrid Single-Particle Lagrangian Integrated Trajectory (http://www.ready.noaa.gov/ready/open/hysplit4.html) • Unversity of Maryland FIRMS Web Fire Mapper(http://firefly.geog.umd.edu/firemap/)