Download
1 / 24
250 likes | 519 Vues
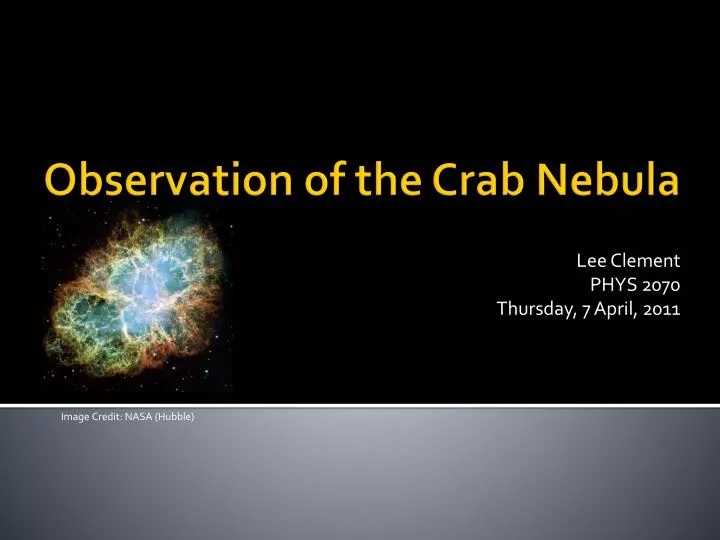
Lee Clement PHYS 2070 Thursday, 7 April, 2011. Observation of the Crab Nebula. Image Credit: NASA (Hubble). M1: The Crab Nebula. Plerionic type remnant of Supernova SN 1054 Filled shell structure powered by pulsar wind (Green) Located in Taurus

E N D
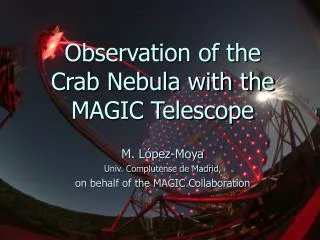
Lee Clement PHYS 2070 Thursday, 7 April, 2011 Observation of the Crab Nebula Image Credit: NASA (Hubble)
M1: The Crab Nebula • Plerionic type remnant of Supernova SN 1054 • Filled shell structure powered by pulsar wind (Green) • Located in Taurus • RA: 05h 34m 31.95s Dec: +22° 58’ 54.4” (J2000) (Cutri et al.) • First observed by John Bevis (1731) • Independently rediscovered by Charles Messier (1758) • Distance: 1930 pc (Trimble, 1973) • Angular size: 6’ x 4’ (Dyer) • Magnitude: 8.4 (Dyer) Image Credit: Stellarium
GAO Data Collection • 20-21 January, 2011 • Conditions • Cold! (-27 C) • Sunset: 17:03 • Moonrise: 18:38 • Waning gibbous with 99% of the visible disc illuminated • Hoped to get data before moon got too high • Cloud: Initially none • Worsened over the course of the evening • Sky glow: Initially some to the North (Winnipeg) • SQM: 19.61 • Worsened as moon rose and clouds rolled in • SQM: 17.15 around 20:45 • SQM: 15.63 around 21:30
Data Collection Challenges • Series of unfortunate events • Deadbolt on dome side door frozen shut • Possibly inadequate temperature equalization inside dome • Telescope would only focus in one direction • Had to wait for Jennifer • Wire had become disconnected in dome • Rheostat adjustment needed in fuse panel • Dome froze stuck • M1 had drifted past the edge of the aperture • Spent ~30 mins trying to assist dome motor to rotate dome • End result • Not able to start collecting data until 21:20 • Bright moon • Partial cloud cover
Raw Data • 30 x 60-sec exposures • Large variations in brightness • Variable clouds • Bright moon
Calibration Frames: Master Bias • To sample readout noise of the CCD chip • Average of 10 x 0-sec exposures
Calibration Frames: Master Dark • To correct for thermal noise in the CCD chip • 5 x 60-sec exposures with the shutter closed • Master bias subtracted then frames averaged • Interesting feature: periodic noise • Unknown source
Calibration Frames: Master Flat • To correct for illumination variations, dust, etc. • 30 x 60-sec exposures of sky regions near M1 • Master bias and master dark subtracted • Normalized to mean value of 1 • Median taken • Also exhibits periodic noise • Unknown source
Image Registration • Master bias and master dark subtracted from raw data • Result divided by master flat • Registered images in 3 parts • Brightness variations • Discarded 5 frames
Reduced Data • Average of registered calibrated images • Problem: • Persistent gradient from northeast to southwest E N
Gradient Removal • Used ImageJ’s ‘Subtract Background’ function • Radius: 300.0 px • Create background • Sliding paraboloid • Produced a model of the gradient
Gradient Removal • Subtracted gradient model from reduced data E N
Expansion Rate • Nugent (1998) measured the expansion of the Crab Nebula • Scans of 4 high-resolution photographs • Measured the motion of several filaments of the Crab’s structure • Measuring filaments not feasible with GAO data • Too blurry • Needed to look at larger scale features instead • Compared GAO image to POSS I (1951) and POSS II (1991) red filter images
Expansion Rate N N N • Took the square root of the gradient-subtracted image to enhance contrast around the edges • Vertically flipped to match orientation • Resized POSS I and POSS II images to be a similar scale to GAO image • Also stretched brightness so that only portions visible in GAO image were visible • Some guesswork E E E GAO (2011) POSS I (1951) POSS II (1991)
Calibration of Image Scale N • Made use of the bottom two stars of the southwest trapezoid formation • In Aladin, measured separation on POSS I and POSS II images • Distance: 1.09’ E 1.09’
Measurement Methodology N N N • Initially intended to measure distance from central pulsar to various features • Problem: Not obvious where the centre is E E E GAO (2011) ? ? POSS I (1951) POSS II (1991)
Measurement Methodology • Alternative method • Measured distance between two sets of easily distinguishable features • Tried to approximate the major and minor axes GAO (2011)
Measurements • All measurements made using line segments in ImageJ
Analysis • Plotted measured “axis” distances against Julian dates of observations • Calculated slopes of lines of best fit to approximate rate of expansion • Similar for both “axes” • Uniformly expanding
Results • Rate of expansion was found to be 0.5 arcsec/yr • Inconsistent with published value of 0.15 arcsec/yr (Bietenholz) • Extrapolated to point of zero size to determine original date of supernova • Found CE 1405 ± 29 • Inconsistent with result of Nugent (1998): CE 1130 ± 16 • Inconsistent with result of Trimble (1968): CE 1140 ± 15 • Closer to result of Bietenholz (1991): CE 1245 ± 92 • Measured only the synchrotron component • However, known date of supernova is CE 1054 • Confirms result that expansion of the Crab Nebula is accelerating • Exact expansion function unknown (Nugent)
Sources of Error • Very limited data set • Low detail of GAO data precluded measuring more than a few features • Random errors would average out with more measurements • Guesswork involved in determining what parts of POSS I and POSS II images were visible in GAO image • Guesswork involved in matching edges of features between images
Summary • Despite unfortunate observing conditions, managed to acquire data that shows some large-scale structure of the Crab Nebula • Data not so good for astrometry! • Calculated expansion rate inconsistent with previous results • Calculated date of supernova inconsistent with previous results • Still later than actual date • Confirms acceleration of expansion E N
References Bietenholz, M. F., Kronberg, P. P., Hogg, D. E. and Wilson, A. S. The Expansion of the Crab Nebula 1991 Cutri, et al. 2MASS All-Sky Catalog of Point Sources 2003 Dyer, Alan. The Messier Catalogue 2010 Green, Dave. G184.6-5.8 2009 Trimble, Virginia. The Distance to the Crab Nebula and NP 0532 1973 Trimble, Virginia. Motions and Structure of the Filamentary Envelope of the Crab Nebula 1968 Images: http://hubblesite.org/gallery/album/pr2005037a/ http://archive.stsci.edu/dss/