Download
1 / 11
110 likes | 204 Vues
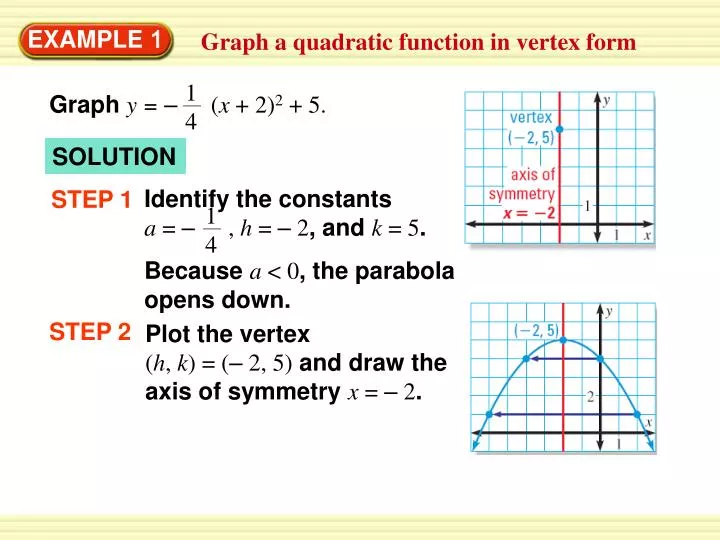
Identify the constants a = – , h = – 2 , and k = 5 . Because a < 0 , the parabola opens down. 14. 14. EXAMPLE 1. Graph a quadratic function in vertex form. Graph y = – ( x + 2) 2 + 5. SOLUTION. STEP 1. STEP 2.

E N D
Identify the constants a = – , h = – 2, and k = 5. Because a < 0, the parabola opens down. 14 14 EXAMPLE 1 Graph a quadratic function in vertex form Graphy= – (x + 2)2 + 5. SOLUTION STEP 1 STEP 2 Plot the vertex (h, k) = (– 2, 5) and draw the axis of symmetry x = – 2.
– – x = 0: y = (0 + 2)2 + 5 = 4 x = 2: y = (2 + 2)2 + 5 = 1 14 14 EXAMPLE 1 Graph a quadratic function in vertex form STEP 3 Evaluate the function for two values of x. Plot the points (0, 4) and (2, 1) and their reflections in the axis of symmetry. Draw a parabola through the plotted points. STEP 4
The Tacoma Narrows Bridge in Washington has two towers that each rise 307 feet above the roadway and are connected by suspension cables as shown. Each cable can be modeled by the function. 1 7000 y =(x – 1400)2 + 27 EXAMPLE 2 Use a quadratic model in vertex form Civil Engineering where xand yare measured in feet. What is the distance dbetween the two towers ?
EXAMPLE 2 Use a quadratic model in vertex form SOLUTION The vertex of the parabola is (1400, 27). So, a cable’s lowest point is 1400 feet from the left tower shown above. Because the heights of the two towers are the same, the symmetry of the parabola implies that the vertex is also 1400 feet from the right tower. So, the distance between the two towers is d = 2 (1400) = 2800 feet.
for Examples 1 and 2 GUIDED PRACTICE Graph the function. Label the vertex and axis of symmetry. 1. y = (x + 2)2– 3 SOLUTION Identify the constants a = 1 , h = – 2, and k = – 3. Because a > 0, the parabola opens up. STEP 1 STEP 2 Plot the vertex (h, k) = (– 2, – 3) and draw the axis of symmetry x = – 2.
for Examples 1 and 2 GUIDED PRACTICE STEP 3 Evaluate the function for two values of x. x = 0: y = (0 + 2)2 + – 3 = 1 x = 2: y = (2 + 2)2– 3 = 13 Plot the points (0, 4) and (2, 1) and their reflections in the axis of symmetry. Draw a parabola through the plotted points. STEP 4
for Examples 1 and 2 GUIDED PRACTICE 2. y = – (x + 1)2+ 5 SOLUTION Identify the constants a = 1 , h = – 2, and k = – 3. Because a < 0, the parabola opens down. STEP 1 STEP 2 Plot the vertex (h, k) = (– 1, 1) and draw the axis of symmetry x = – 1. STEP 3 Evaluate the function for two values of x. x = 0: y = – (0 + 2)2 + 5 = 4 x = 2: y = – (0 – 2)2 + 5 = 1 Plot the points (0, 4) and (2, 1) and their reflections in the axis of symmetry.
for Examples 1 and 2 GUIDED PRACTICE Draw a parabola through the plotted points. STEP 4
Identify the constants a = , h = – 3, and h = – 4. 12 52 12 12 12 x = 0: f(x)= (0 – 3)2–4 = – 3 2 x = 0: f(x)= (2 – 3)2–4 = for Examples 1 and 2 GUIDED PRACTICE 3. f (x) = (x – 3)2– 4 SOLUTION STEP 1 Because a > 0, the parabola opens up. STEP 2 Plot the vertex (h, k) = (– 3, – 4) and draw the axis of symmetry x = – 3. STEP 3 Evaluate the function for two values of x.
for Examples 1 and 2 GUIDED PRACTICE Plot the points (0, 4) and (2, 1) and their reflections in the axis of symmetry. Draw a parabola through the plotted points. STEP 4
1 6500 y = (x – 1400)2 + 27 for Examples 1 and 2 GUIDED PRACTICE 4. WHAT IF?Suppose an architect designs a bridge with cables that can be modeled by where x and y are measured in feet. Compare this function’s graph to the graph of the function in Example 2. SOLUTION This graph is slightly steeper than the graph in Example 2. They both have the same vertex and axis of symmetry, and both open up. Solution missing