Download
1 / 1
10 likes | 175 Vues
High resolution discovery and characterization of copy number variation using oligonucleotide DNA Microarrays Anniek De Witte, Shane Giles, Anya Tsalenko, Jayati Ghosh, Dione Bailey, Doug Amorese Agilent Technologies, 5301 Stevens Creek Blvd., Santa Clara, CA 95051, USA. Abstract # 5137.

E N D
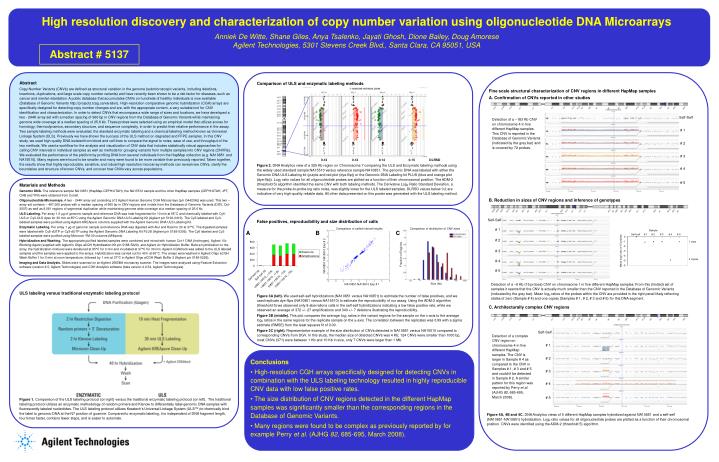
High resolution discovery and characterization of copy number variation using oligonucleotide DNA Microarrays Anniek De Witte, Shane Giles, Anya Tsalenko, Jayati Ghosh, Dione Bailey, Doug Amorese Agilent Technologies, 5301 Stevens Creek Blvd., Santa Clara, CA 95051, USA Abstract # 5137 Abstract Copy Number Variants (CNVs) are defined as structural variation in the genome (submicroscopic variants, including deletions, insertions, duplications, and large scale copy number variants) and have recently been shown to be a risk factor for diseases, such as cancer and mental retardation. A public database that accumulates CNVs on hundreds of healthy individuals is now available (Database of Genomic Variants http://projects.tcag.ca/varation). High-resolution comparative genomic hybridization (CGH) arrays are specifically designed for detecting copy number changes and are, with the appropriate content, a very suitable tool for CNV identification and characterization. In order to detect CNVs that encompass a wide range of sizes and locations, we have developed a two - 244K array set with a median spacing of 960 bp in CNV regions from the Database of Genomic Variants while maintaining genome wide coverage at a median spacing of 25.6 kb. These probes were selected using an empirical model that utilizes scores for homology, thermodynamics, secondary structure, and sequence complexity, in order to predict their relative performance in the assay. Two sample labeling methods were evaluated, the standard enzymatic labeling and a chemical labeling method known as Universal Linkage System (ULS). Previously we have shown the success of the ULS method on degraded and FFPE samples. In this CNV study, we used high quality DNA isolated from blood and cell lines to compare the signal to noise, ease of use, and throughput of the two methods. We used a workflow for the analysis and visualization of CNV data that includes statistically robust approaches for calling CNV intervals in individual samples as well as methods for grouping variants from multiple samples into CNV regions (CNVRs). We evaluated the performance of the platform by profiling DNA from several individuals from the HapMap collection (e.g. NA10851 and NA15510). Many regions were found to be smaller and many were found to be more variable than previously reported. Taken together, the results show that highly reproducible, sensitive, and robust high resolution microarray methods can reveal new CNVs, clarify the boundaries and structure of known CNVs, and uncover how CNVs vary across populations. Comparison of ULS and enzymatic labeling methods Fine scale structural characterization of CNV regions in different HapMap samples A. Confirmation of CNVs reported in other studies Self-Self Detection of a ~183 Kb CNV on chromosome 4 in five different HapMap samples. This CNV is reported in the Database of Genomic Variants (indicated by the grey bar) and is covered by 72 probes. # 1 # 2 # 3 0.12 0.12 0.14 0.15 DLRSD Figure 2. DNA Analytics view of a 325 Kb region on Chromosome 7 comparing the ULS and Enzymatic labeling methods using the widely used standard sample NA15510 versus reference sample NA10851. The genomic DNA was labeled with either the Genomic DNA ULS Labeling kit (purple and red plot (dye-flip)) or the Genomic DNA Labeling kit PLUS (blue and orange plot (dye-flip)). Log2 ratio values for all oligonucleotide probes are plotted as a function of their chromosomal position. The ADM-2 (threshold 5) algorithm identified the same CNV with both labeling methods. The Derivative Log2 Ratio Standard Deviation, a measure for the probe-to-probe log ratio noise, was slightly lower for the ULS labeled samples. DLRSD values below 0.2 are indicative of very high-quality reliable data. All other data presented on this poster was generated with the ULS labeling method. # 4 # 5 Materials and Methods Genomic DNA. The reference sample NA10851 (HapMap-CEPH/UTAH), the NA15510 sample and the other HapMap samples (CEPH/UTAH, JPT, CHB and YRI) were obtained from Coriell. Oligonucleotide Microarrays. A two - 244K array set consisting of 2 Agilent Human Genome CGH Microarrays (p/n G4423A)) was used. This two – array set contains ~ 487,000 probes with a median spacing of 960 bp in CNV regions and in-dels from the Database of Genomic Variants (DGV, Oct-2007) as well as 8,061 regions of segmental duplication while maintaining genome wide coverage at a median spacing of 25.6 kb. ULS Labeling. Per array 1.5 µg of genomic sample and reference DNA was heat fragmented for 10 min at 95°C and chemically labeled with Cy5-ULS or Cy3-ULS dyes for 30 min at 85°C using the Agilent Genomic DNA ULS Labeling Kit (Agilent p/n 5190-0419). The Cy5-labeled and Cy3-labeled samples were purified using Agilent-KREApure columns supplied with the Agilent Genomic DNA ULS Labeling Kit. Enzymatic Labeling. Per array 1 µg of genomic sample and reference DNA was digested with AluI and RsaI for 2h at 37°C. The digested samples were labeled with Cy5-dUTP or Cy3-dUTP using the Agilent Genomic DNA Labeling Kit PLUS (Agilent p/n 5188-5309). The Cy5 labeled and Cy3 labeled samples were purified using Microcon YM-30 columns (Millipore). Hybridization and Washing. The appropriate purified labeled samples were combined and mixed with human Cot-1 DNA (Invitrogen), Agilent 10x Blocking Agent (supplied with Agilent’s Oligo aCGH Hybridization Kit p/n 5188-5220), and Agilent 2x Hybridization Buffer. Before hybridization to the array, the hybridization mixtures were denatured at 95°C for 3 min and incubated at 37°C for 30 min. Agilent-CGHblock was added to the ULS labeled samples and the samples were applied to the arrays. Hybridization was carried out for 40 h at 65°C. The arrays were washed in Agilent Oligo aCGH Wash Buffer 1 for 5 min at room temperature, followed by 1 min at 37°C in Agilent Oligo aCGH Wash Buffer 2 (Agilent p/n 5188-5226). Imaging and Data Analysis. Slides were scanned on an Agilent 2565BA microarray scanner. The images were analyzed using Feature Extraction software (version 9.5, Agilent Technologies) and CGH Analytics software (beta version 4.0.54, Agilent Technologies). B. Reduction in sizes of CNV regions and inference of genotypes Self-Self False positives, reproducibility and size distribution of calls Comparison of called interval heights Comparison of distribution of CNV sizes # 1 A B C Self-self # 1 # 2 # 3 # 4 # 5 # 2 1 copy # 3 Fraction of Regions NA10851-NA15510 Exp # 2 0 copies # 4 # 5 Size (kb) Detection of a ~6 Kb (15 probes) CNV on chromosome 1 in five different HapMap samples. From this (limited) set of samples it seems that the CNV is actually much smaller than the CNV reported in the Database of Genomic Variants (indicated by the grey bar). Mean log2 ratios of the probes within the CNV are provided in the right panel likely reflecting states of zero (Sample # 4) and one copies (Samples # 1, # 2, # 3 and # 5) for this DNA segment. NA10851-NA15510 Exp # 1 ULS labeling versus traditional enzymatic labeling protocol Figure 1. Comparison of the ULS labeling protocol (on right) versus the traditional enzymatic labeling protocol (on left). The traditional labeling protocol utilizes an enzymatic methodology of random primers and Klenow to differentially label genomic DNA samples with fluorescently labeled nucleotides. The ULS labeling protocol utilizes Kreatech’s Universal Linkage System (ULS™) to chemically bind the label to genomic DNA at the N7 position of guanine. Compared to enzymatic labeling, it is independent of DNA fragment length, four times faster, contains fewer steps, and is easier to automate. Figure 3A (left). We used self-self hybridizations (NA10851 versus NA10851) to estimate the number of false positives, and we used replicate dye-flips (NA10851 versus NA15510) to estimate the reproducibility of our assay. Using the ADM-2 algorithm (threshold 5) we observed only 8 aberrations calls in the self-self hybridizations indicating a low false positive rate, while we observed an average of 372 +/- 27 amplifications and 343 +/- 7 deletions illustrating the reproducibility. Figure 3B (middle). This plot compares the average log2 ratios in the variant regions for the sample on the x-axis to the average log2 ratios in the same regions for the replicate sample on the y-axis. The correlation between the replicates was 0.99 with a sigma estimate (RMSE) from the least squares fit of 0.09. Figure 3C (right). Representative example of the size distribution of CNVs detected in NA10851 versus NA15510 compared to corresponding CNVs from DGV. In this study, the median size of detected CNVs was 4 Kb; 124 CNVs were smaller than 1000 bp, most CNVs (371) were between 1 Kb and 10 Kb in size, only 7 CNVs were larger than 1 Mb. C. Architecturally complex CNV regions Self-Self Detection of a complex CNV region on chromosome 4 in five different HapMap samples. The CNV is larger in Sample # 4 as compared to the CNV in Samples # 1, # 3 and # 5 and couldn’t be detected in Sample # 2. A similar pattern for this region was reported by Perry et al. (AJHG 82, 685-695, March 2008). # 1 # 2 • Conclusions • High-resolution CGH arrays specifically designed for detecting CNVs in combination with the ULS labeling technology resulted in highly reproducible CNV data with low false positive rates. • The size distribution of CNV regions detected in the different HapMap samples was significantly smaller than the corresponding regions in the Database of Genomic Variants. • Many regions were found to be complex as previously reported by for example Perry et al. (AJHG 82, 685-695, March 2008). # 3 # 4 # 5 Figure 4A, 4B and 4C. DNA Analytics views of 5 different HapMap samples hybridized against NA10851 and a self-self (NA10851-NA10851) hybridization. Log2 ratio values for all oligonucleotide probes are plotted as a function of their chromosomal position. CNVs were identified using the ADM-2 (threshold 5) algorithm.