Download
1 / 25
650 likes | 2.62k Vues
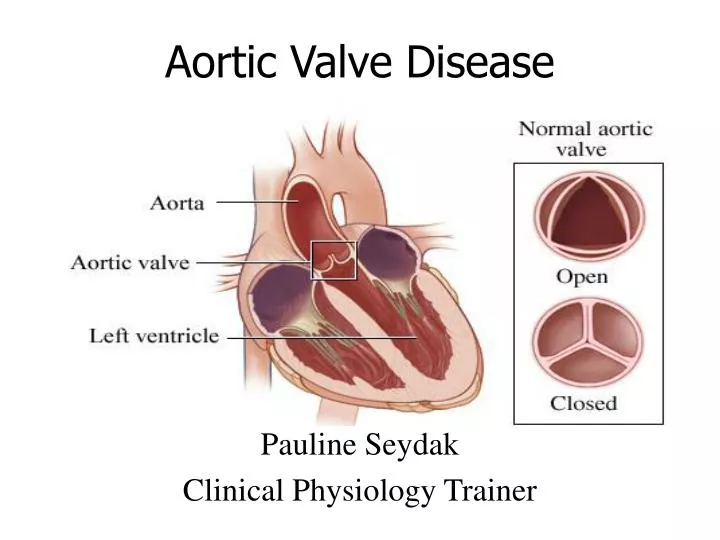
Aortic Valve Disease. Pauline Seydak Clinical Physiology Trainer. Normal AV. The aortic valve controls the direction of blood flow from the left ventricle to the aorta . The aortic valve has three flaps, called "cusps," or “leaflets” that open and close.

E N D
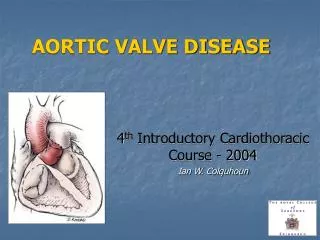
Aortic Valve Disease Pauline Seydak Clinical Physiology Trainer
Normal AV The aortic valve controls the direction of blood flow from the left ventricle to the aorta. The aortic valve has three flaps, called "cusps," or “leaflets” that open and close. During ventricular systole, pressure rises in the left ventricle. When the pressure in the left ventricle rises above the pressure in the aorta, the aortic valve opens, allowing blood to exit the left ventricle into the aorta. When ventricular systole ends, pressure in the left ventricle rapidly drops. When the pressure in the left ventricle decreases, the aortic pressure forces the aortic valve to close.
Aortic Cusps Coronary arteries A feature to note is the presence of three aortic sinuses, one for each cusp. These are indentations, or bulges, in the aortic root which change the fluid dynamics of the valve significantly. It is believed that the sinuses cause the formation of vortices that aid in valve closure. Two coronary arteries branch out from two of the sinuses, termed the left coronarysinusand right coronary sinus. The other sinus is called the non-coronary or posterior sinus. The cusps are named accordingly.
Malfunctions • If the valve does not open fully, it will obstruct the flow of blood. This is called valve stenosis. • If the valve does not close properly, it will allow blood to leak backwards. This is called valve incompetence or regurgitation. • Heart valves can have both malfunctions at the same time (regurgitation and stenosis). Also, more than one heart valve can be affected at the same time.
Cause of Heart Valve Disease The main causes of heart valve disease Being born with an abnormal valve or valves (congenital heart disease) The effects of rheumatic fever Ageing of the heart Cardiomyopathy Ischaemic heart disease or A previous infection with endocarditis
Aortic Stenosis Aortic stenosis (AS), also called aortic valve stenosis, is a condition in which the aortic valve has become narrowed or constricted (stenotic) and does not open-and-close properly. The leaflets may be calcified, thickened, have reduced mobility and thus restricted opening. A common congenital abnormality of the heart is the bicuspid aortic valve. In this condition, instead of three cusps, the aortic valve has two cusps.
Supravalvular/Subvalvular Occasionally the obstruction does not involve the Aortic valve B itself but consists of a narrowing of the passage either above Supravalvular or below Subvalvular it. Supravalvular: The narrowing is in the Aorta itself immediately above the valve A Subvalvular: The narrowing occurs within the Left Ventricular Outflow tract below the Aortic valve C A B C
Stenotic AV When the aortic valve becomes stenotic, it causes a pressure gradient between the left ventricle (LV) and the aorta. The more constricted the valve, the higher the gradient between the LV and the aorta. For instance, with a mild AS, the gradient may be 30 mmHg. This means that, at peak systole, while the LV may generate a pressure of 140 mmHg, the pressure that is transmitted to the aorta will only be 110 mmHg. – a pressure difference of 30mmHg An aortic valve that, due to rheumatic heart disease, has a severe stenosis (centre of image). The pulmonary trunk is seen at the lower right (of the image).
Assessing Aortic Stenosis • Appearance of valve: Look at number of cusps, degree and distribution of thickening and cusp mobility. These may give a clue to the etiology: • Assess left ventricle: look for left ventricular hypertrophy which suggests(but does not prove) severe stenosis • Doppler Measurements
Number of AV Leaflets/Cusps During systole, the anterior and posterior cusps move away from each other and open to form a box-like opening or parallelogram shape. During diastole the 3 cusps form a central closure line in the aortic lumen.The closure line is nearly equidistant from the anterior and posterior aortic walls In AS, the closure line and box like opening are replaced by multiple thick dense echoes. Individual cusps and their motion are hard to decipher.The size of box-like opening is reduced
Appearance of Valve Leaflets A Valve leaflets thicken due to fibrosis with or without calcification. This effects their mobility and excursion. In Rheumatic AS, the process starts in the leaflets with fusion of commissures followed by secondary calcification of leaflets and annulus(Fig. A) In Calcific AS, the process starts with calcification of the annulus and progresses medially to involve the leaflets (Fig. B) PLAX view – calcification of Leaflets B PSAX view – calcification of annulus
The left ventricle initially compensates for increased resistance caused by aortic stenosis by thickening to help eject blood through the stenotic aortic valve into the aorta. The myocardium (muscle) of the LV undergoes hypertrophy (increase in muscle mass). The type of hypertrophy most commonly seen in AS is concentric hypertrophy, meaning that all the walls of the LV are (approximately) equally thickened. . LV Hypertrophy
Doppler Measurements Doppler echocardiography is the recommended initial test for patients with classic symptoms of aortic stenosis. It is helpful for estimating: Maximum/peak aortic velocity: Peak and mean transvalvular gradients: Aortic valve area. These are the primary measures for assessing disease severity. Multiple windows need to be examined to obtain parallelism between the Doppler beam and aortic flow and thus to estimate the true peak aortic velocity (Vmax). APX – apical 5-chamber view SSN– suprasternal notch RPS – right parasternal window
Aortic flow velocity by Doppler echo Aortic flow is estimated by placing the Doppler cursor just beyond the aortic valve (subvalvular) in the apical five chamber view. If the velocity is high as in AS, continuous wave (CW) Doppler has to be used to avoid aliasing. A good estimate requires that the cursor and the jet has a parallel alignment. Angle correction can be applied using built in software in most echocardiographic machines. Errors will be high if the mal-alignment is more than 20 degrees.
Bernoulli,s Equation Using the velocity of the blood through the valve, the pressure gradient across can be calculated by use of: Bernoulli's equation This is a complex formula that relates the pressure drop (or gradient) across an obstruction to many factors. For practical use in Doppler echocardiography a modified formula is used in two forms: Short modified Bernoulli Long modified Bernoulli
Short modified Bernoulli equation V1 This short form can be used when subvalvular V1 is much less than transvalvular V2 velocity, e.g. moderate or severe AS (v2>3.0m/s) but not mild aortic stenosis or normal functioning replacement valves. The formulae is: P = 4V2 mmHg Gradient = 4(velocity)² mmHg The formula's are inbuilt in the equipment software. V2
Long modified Bernoulli equation If the Vmax (peak velocity) is < 3.0m/sec either avoid estimation of pressure drop altogether or use the long form of the Bernoulli equation. This will require a pulsed Doppler measurement in the Left Ventricular outflow tract (LVOT). The formulae is : P = 4(V22-V12) Where V1 is the peak LVOT velocity and V2 the peak transvalvular velocity Peak AV Velocity PeakVelocity
Continuity Equation Transaortic pressure gradient depends on variables including heart rate, stroke volume, etc and may not be a true indicator of the severity of valve stenosis. Calculation of the aortic valve area (AVA), also referred to as effective orifice area (EOA) using Continuity equation is more accurate The Continuity equation relies on the simple principle that the volume of blood leaving the LV is equal to the volume of blood crossing the AV.
Evaluation of Valve Area AS severity is based on measurement of LVOT diameter(D) in a parasternal long-axis view for calculation of a circular cross-sectional area (CSA), LVOT (V) from an apical approach using pulsed Doppler , and the maximum aortic jet from the continuous-wave Doppler recording. Either velocity-time integrals (VTIs) or maximum velocities can be used in the continuity equation for aortic valve area (AVA). * *
Velocity Time Integral (VTI) Velocity Time Integral (VTI) is the area measured under the Doppler velocity envelope for one heartbeat. The mean gradient is calculated from the VTI of aortic outflow and can be estimated by manually or electronically sketching out the envelope of the jet and the computer programme generates the mean gradient display.
Planimetry of Valve Area Planimetry is the tracing out of the opening of the aortic valve in a still image obtained during echocardiographic acquisition during ventricular systole, when the valve is supposed to be open. While this method directly measures the valve area, the image may be difficult to obtain due to artifacts during echocardiography, and the measurements are dependent on the operator who has to manually trace the perimeter of the open aortic valve. Because of these reasons, planimetry of aortic valve is not routinely performed. Valve closed Valve open
Color Flow Doppler Characteristics Proximal to the stenosis flow is Laminar as is displayed by the solid blue colour. (picture A) Near the point of maximum stenosis the flow velocity increases. Turbulent flow is present distal to the stenosis and is represented by the mosaic colours in the aorta.
Pedoff or Stand alone transducer A comprehensive Doppler examination for aortic stenosis requires that “Pedoff” or “blind”probe is used during assessment This stand alone transducer does not share bandwidth with the imaging component of the inline transducer and may detect significantly higher gradients across the valve Doppler examination for aortic stenosis will add an average of 15-30 minutes to the two-dimensional and routine Doppler echocardiographic examination, even with the experienced operator.
Classification of Aortic Stenosis Moderate and severe stenosis can be difficult to distinguish because of the influence of Left ventricular function . Report should include LV dimensions and systolic function Appearance of the Aortic valve Severity of stenosis Other valves Right ventricular function (pulmonary artery pressure if indicated) Clinical findings
Example BSE Questions • 1) Severe Aortic Stenosis: • Always results in a ventricular diastolic septal width > 1.3cm • May be associated with an aortic valve area of 1cm2 if LV function is poor • Is a cause of Aortic dilatation • Predisposes the patient to endocarditis • Can only be diagnosed if the continuity equation is used. • 2 ) A Transaortic peak systolic Doppler velocity of 2.5m/sec is compatible with: • Pure aortic regurgitation • Moderate aortic stenosis • Normal bio prosthesis function • Anxiety • Large ventricular septal defectHappy Revision