Download
1 / 39
400 likes | 505 Vues
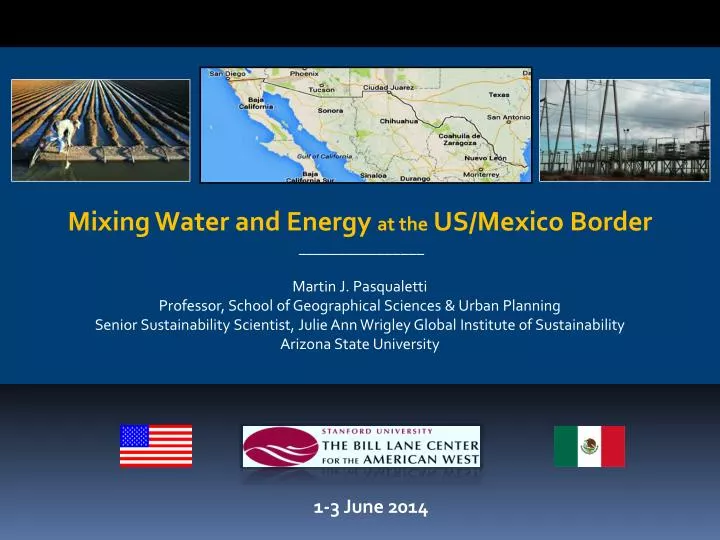
Mixing Water and Energy at the US/Mexico Border ________________ Martin J. Pasqualetti Professor, School of Geographical Sciences & Urban Planning Senior Sustainability Scientist, Julie Ann Wrigley Global Institute of Sustainability Arizona State University. 1-3 June 2014.

E N D
Mixing Water and Energy at the US/Mexico Border ________________ Martin J. Pasqualetti Professor, School of Geographical Sciences & Urban Planning Senior Sustainability Scientist, Julie Ann Wrigley Global Institute of Sustainability Arizona State University 1-3 June 2014
Background References • Scott Kelley and Martin J. Pasqualetti. 2013. Virtual Water from a Vanishing River. Journal – American Water Works Association. 105:9. September. • Martin J. Pasqualetti. 2012. Reading the Changing Energy Landscape. In Sustainable Energy Landscapes: Designing, Planning, and Development, Sven Stremke and Andy Van Den Dobbelsteen, eds. CRC Press, pp. 11-44. • Christopher Scott and Martin J. Pasqualetti. 2011. Energy and Water Resources Scarcity: Critical Infrastructure for Growth and Economic Development in Arizona and Sonora. Natural Resources Journal, 50 (3): 645-682. • Martin J. Pasqualetti. 2011. Social Barriers to Renewable Energy Landscapes. The Geographical Review , 101 (2). • Ron Pate and Martin J. Pasqualetti. Workshop on Climate Change and Energy, Water and Land Interactions November 7-8, 2011 Washington, DC • Martin J. Pasqualetti. 2001. Morality, Space, and the Power of Wind-Energy Landscapes, The Geographical Review, 90(3):381-394. • Martin J. Pasqualetti. 1980. Geothermal Energy and the Environment: The Global Experience, Energy: The International Journal, 5:111-165.
Outline Part One - The Energy/Water Nexus Part Two - Imperial County Water Part Three - Imperial County Renewables Part Four - Imperial County Future
Part One The Energy/Water Nexus
Humanity’s Top 10 Problems for the Next 50 Years • Energy • Water • Food • Environment • Poverty • Terrorism and War • Disease • Education • Democracy • Population Source: Nobel laureate, Richard Smalley
Water Withdrawals for Power Plant CoolingExceeds Any Other use
Part Two Imperial County Water
The Lower Colorado River Phoenix
Precipitation Potential Evapotranspiration Source: Jose M. Güereña, Surface Water Resources for Hermosillo, Sonora, Mexico. Analysis of the Sonora River.
Colorado River Basin • 7 states • 30 million people • 4 million acres irrigated • 4,200 MW hydropower • 15 Native American Tribes • 7 National Wildlife Refuges • 4 National Recreation Areas • 5 National Parks
CRB Demand Up, Supply Down Source: USBR, Doug Kenney
Problem #1Evaporation and Bank Storage at CRB Hydroelectric Reservoirs Lake Mead - 648,000 ac-ft/yr Lake Powell - 553,000 ac-ft/yr
Problem #2 Transfers of Virtual Water from Electrical Generation in the Colorado River Watershed330,000 Ac-Ft/yr (407 Mm3/yr); ~ 50% exported outside the CRB) Source: Scott Kelley and Martin J. Pasqualetti. Virtual Water from a Vanishing River Journal – American Water Works Association. 105:9. September. 2013.
Problem #3 – Imperial Valley water use Source: William Bowen
The Imperial Valley gets 20% of all the water from the Colorado River – more than Nevada and Colorado combined. It uses 5.6 acre-feet of water per acre per year. Imperial County, with a population of 175,000, gets 3.1 million acre-feet of water a year.
Source: Imperial County: Agricultural Crop and Livestock Report, 2012 http://www.co.imperial.ca.us/ag/Departments_A/agricultural_crop_&_livestock_reports.htm
Part Three Imperial County Renewables
Three Important Renewable Resources Photo by: CLUI Centinela Solar Energy Project Photo by: John Gibbins U~T San Diego. Ocotillo Wind Farm Heber Geothermal Plant
Imperial County Wind, Geothermal and Hydro Installations geothermal geothermal geothermal wind geothermal hydro Source: Energy Information Administration. http://www.eia.gov/state/?sid=CA
Imperial CountySolar Projects Source: Center for Land Use Interpretation. http://www.clui.org/content/major-solar-power-plants-usa
Rare and Valuable Synergies Neutralize Intermittency of wind and solar “THE BATTERY” Geothermal is available 98% of the time and can be dispatched at the request of power grid operators @ 2-3MW/minute
*2013 ^2011 ***2014 ^* @ 20% capacity factor Sources: EIA Electricity Data Browser - http://www.eia.gov/electricity/data/browser/ CLUI - http://www.clui.org/content/major-solar-power-plants-usa
Operational water consumption and withdrawal factors for electricity generating technologies Figure 1 from Operational water consumption and withdrawal factors for electricity generating technologies: a review of existing literature. J Macknick et al 2012 Environ. Res. Lett. 7 045802 doi:10.1088/1748-9326/7/4/045802
Displace Agriculture with Electricity* • $787 million/yr in value** • This is more than 40% of the value of the agriculture, but with little water required. • 1/3 less water = 1 million ac-ft * Assuming little to no outside water used in generation. ** @ 13.5 cents/kWh average California price for electricity. Source: State Electricity Profiles (2012) - http://www.eia.gov/electricity/state/
Part Four Imperial County Futures
Some People Oppose RE Source: http://www.windwiseradio.org/tag/ocotillo/
While Others Encourage It Source: Loop-Net.com/geothermal-land/5/
Sequence of Acceptance of RE Based on research by Maarten Wolsink Martin J. Pasqualetti. 2001. Morality, Space, and the Power of Wind-Energy Landscapes, The Geographical Review, 90(3):381-394.
Motivations of AG > RE Exchange • Save water for other purposes • Decrease air emissions from conventional • Increase land values and tax revenues • Increase energy sustainability • Concentrate on high-value crops
Barriers to AG > RE exchange • Employment shifts • Entrenched policies and traditions • Limitations on sale of water within the I.I.D. • Shifts in agricultural products • Loss of Salton Sea
Despite Barriers, the Exchange is Already Underway is Leading the Way
Mixing Water and Energy at theUS/Mexico Border Martin J. Pasqualetti Professor, School of Geographical Sciences & Urban Planning Senior Sustainability Scientist, Julie Ann Wrigley Global Institute of Sustainability Arizona State University Thank You