Download
1 / 4
40 likes | 208 Vues
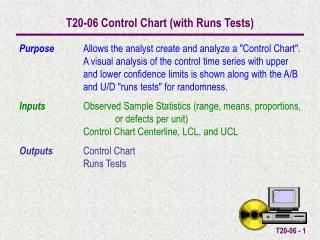
T20-01 Mean Chart (Known Variation) CL Calculations. Purpose Allows the analyst calculate the "Mean Chart" for known variation 3-sigma control limits. Inputs Sample Size Centerline (Grand Average) Process Standard Deviation Outputs Mean Control Chart LCL & UCL. Standard Error.

E N D
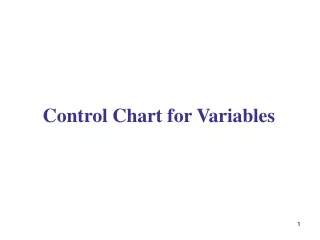
T20-01 Mean Chart (Known Variation) CL Calculations Purpose Allows the analyst calculate the "Mean Chart" for known variation 3-sigma control limits. Inputs Sample Size Centerline (Grand Average) Process Standard DeviationOutputs Mean Control Chart LCL & UCL
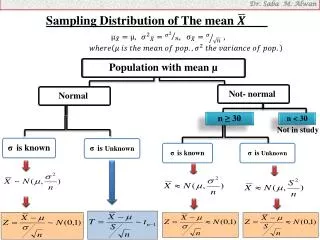
Standard Error Mean Chart ( Chart) - Known Variation The Mean Chart Centerline, UCL and LCL (3 sigma limits) are calculated by the following when the variation of the process isknown.
Example The mean of 20 samples each containing 5 observations are shown here. They have been taken from a process with known variance of .04. The grandaverage can now be calculated. This can be done by using the Descriptive Statistics Template or more quickly by using the EXCEL built inAVERAGEfunction on this set of numbers. Calculate the Control Limits for the Mean Control Chart. Grand Average
The LCL, UCL are automatically calculated Input the Sample Size, Centerline (Grand Average), and Process Standard Deviation in the light green cells.