Download
1 / 22
220 likes | 366 Vues
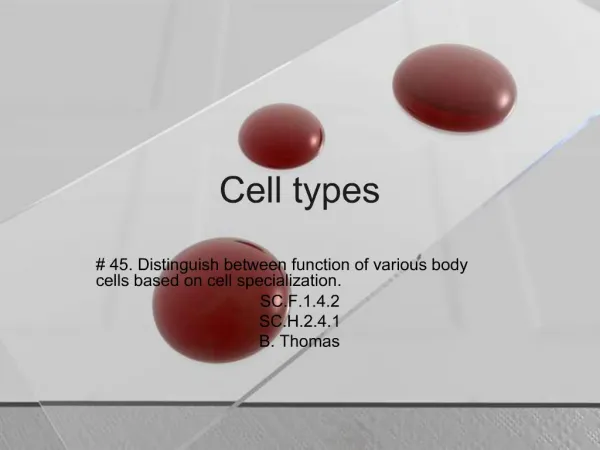
MabThera treatment modulates cell types other than B cells. Professor Paul-Peter Tak Academic Medical Center (AMC)/University of Amsterdam, Amsterdam, the Netherlands. Marked B cell depletion after anti-CD20 therapy. 200. CONTROL. +R. +R+CTX. 150. +R+MTX. Median CD19+ B cells per mm 3.

E N D
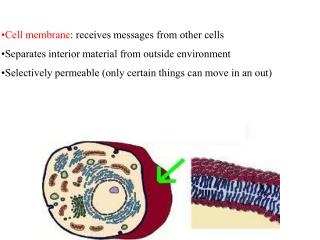
MabThera treatment modulates cell types other than B cells Professor Paul-Peter Tak Academic Medical Center (AMC)/University of Amsterdam, Amsterdam, the Netherlands
Marked B cell depletion after anti-CD20 therapy 200 CONTROL +R +R+CTX 150 +R+MTX Median CD19+ B cells per mm3 100 50 0 0 4 8 12 16 20 24 Time (weeks) Edwards JC et al. N Engl J Med. 2004;17;350:2572-81
Synovial tissue: Primary target of RA Analysis of the target tissue Choy E et al. N Engl J Med. 2001;344:907–16
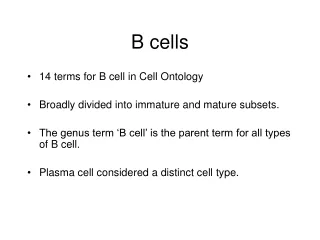
Synovial tissue response to rituximab Open label 17 patients with RA, IgM-RF+ and/or ACPA+ Stable MTX treatment, oral prednisone allowed up to 10 mg/day Previous treatment with anti-TNF allowed (washout) Vos K et al. Arthritis Rheum 2007;56:772-8
Treatment • 2 infusions of 1000 mg rituximab in 2 weeks • No methylprednisolone pre-medication • Steroids reduce synovial inflammation Vos K et al. Arthritis Rheum 2007;56:772-8
Before After Change in CD22+ B cells of individual patients before and 4 weeks after treatment 1100 1000 900 Values for number of CD22+ B cells/mm2 in serial synovialtissue samples are shown for individual patients 800 700 Number of CD22+ B cells (mm2) 350 300 250 200 150 100 50 0 Vos K et al. Arthritis Rheum 2007;56:772-8
Change in CD22+ synovial B cells 4 weeks after treatment with rituximab Before After Patient 1 Patient 2
** Baseline Baseline Week 16 Week 4 Week 4 Change in number of synovial CD22+ B cells and CD3+ T cells after rituximab treatment ** 800 1500 * 1200 600 900 Number of CD22+ B cells (mm2) Number of CD3+ T cells (mm2) 400 600 200 300 0 0 Week 16 Interquartile ranges. Circles represent outliers *p<0.05,**p<0.01 Thurlings RM et al. Ann Rheum Dis 2008;67:917-25
Change in number of synovial lymphocyte aggregates and CD68+ intimal macrophages after rituximab treatment * ** ** 125 1000 100 800 600 75 Number of CD68+ intimal macrophages (mm2) Total number of lymphocyte aggregates 400 50 200 25 0 0 Baseline Week 4 Week 16 Baseline Week 4 Week 16 Interquartile ranges. Circles represent outliers *p<0.05,**p<0.01 Thurlings RM et al. Ann Rheum Dis 2008;67:917-25
Change in number of synovial sublining CD68+ macrophages and CD138+ plasma cells after rituximab treatment * 1400 2500 1200 2000 1000 1500 800 Number of CD68+ sublining macrophages (mm2) Number of CD138+ plasma cells (mm2) 600 1000 400 500 200 0 0 Baseline Week 4 Week 16 Baseline Week 4 Week 16 Interquartile ranges. Circles represent outliers *p<0.05 Thurlings RM et al. Ann Rheum Dis 2008;67:917-25
Synovial tissue response to rituximab treatment • Variable response of synovial B cells • Secondary effects on cells other than B cells • B cells orchestrate synovial inflammation
Is the synovial tissue response predictive of the clinical response to rituximab treatment?
The number of synovial B cells at baseline is not predictive of the clinical response to rituximab treatment 800 600 Number of CD22+ B cells (mm2) 400 200 0 Non-responders Responders Interquartile ranges. Circles represent outliers Thurlings RM et al. Ann Rheum Dis 2008;67:917-25
Change in B cells (baseline–Week 4) Change in B cells (Weeks 4–16) 400 400 200 200 0 0 Number of CD22+ B cells (mm2) Number of CD22+ B cells (mm2) -200 -200 -400 -400 Non-responders Responders Non-responders Responders The change in synovial B cells is not predictive of the clinical response to rituximab treatment Interquartile ranges. Circles represent outliers Thurlings RM et al. Ann Rheum Dis 2008;67:917-25
Baseline plasma cells Baseline intimal macrophages 1000 800 800 600 600 Number of CD68+ intimal macrophages (mm2) Number of CD138+ plasma cells (mm2) 400 400 200 200 0 0 Non-responders Responders Non-responders Responders The number of synovial plasma cells or intimal macrophages at baseline is not predictive of the clinical response to rituximab treatment Thurlings RM et al. Ann Rheum Dis 2008;67:917-25
1000 500 500 0 0 -500 -500 -1000 Non-responders Responders Non-responders Responders Changes in synovial plasma cells and intimal macrophages are predictive of the clinical response to rituximab treatment Change in plasma cells (Weeks 4–16) Change in intimal macrophages (Weeks 4–16) ** ** Number of CD68+ intimal macrophages (mm2) Number of CD138+ plasma cells (mm2) Interquartile ranges. Circles represent outliers *p<0.05 Thurlings RM et al. Ann Rheum Dis 2008;67:917-25
Change in synovial plasma cells is related to clinical improvement 4 weeks after treatment 16 weeks after treatment Responder Non-responder Thurlings RM et al. Ann Rheum Dis 2008;67:917-25
Relationship between changes in the synovium between 4 and 16 weeks and clinical response at24 weeks • Correlation between changes in the synovium and clinical response: • Plasma cells: r=0.46, p=0.003 • Macrophages: r=0.51, p=0.04 • Decrease in plasma cells predicts clinical response (r2=0.26, p=0.002) • Change in plasma cells was correlated with decrease in ACPA levels (r=0.52, p=0.03)
ACPA * 3000 2000 ACPA titre (kU/L) 1000 0 Week 4 Baseline Week 16 Week 24 Week 36 Significant decrease in IgM-RF and ACPA levels after rituximab treatment IgM-RF ** 800 ** 600 IgM-RF titre (kU/L) 400 200 0 Week 4 Baseline Week 16 Week 24 Week 36 Interquartile ranges. Circles represent outliers *p<0.05,**p<0.01 Thurlings RM et al. Ann Rheum Dis 2008;67:917-25
B cell-derived plasma cells may be associated with autoimmunity in the tissue of patients who do not experience a clinical response to the first course of rituximab Benefit of retreatment?
8 6 DAS28 4 2 0 3 6 9 12 15 18 21 24 Baseline Time (months) Sustained benefit from DAS28-based systematic retreatment in initial responders n=16 Thurlings RM et al. Arthritis Rheum 2008;58:3657-64
Conclusions • B cells appear to orchestrate local cellular infiltration • Kinetics of the serological and tissue response suggest that rituximab exerts its effects, in part, by an indirect effect on B cell-derived plasma cells associated with autoantibody production • Initial responders to rituximab experience sustained benefit from DAS28-based systematic retreatment • Rituximab does not induce robust improvement after retreatment of initial non-responders