Download
1 / 8
241 likes | 1.03k Vues
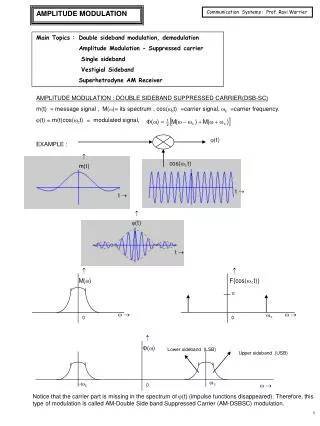
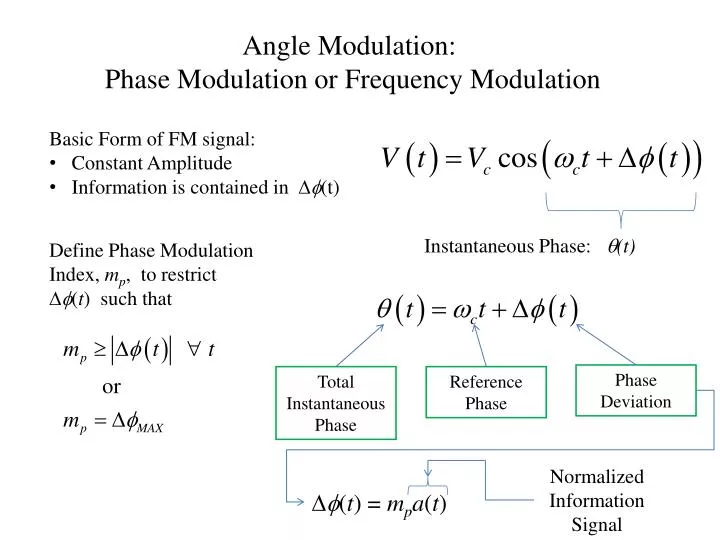
Angle Modulation: Phase Modulation or Frequency Modulation. Basic Form of FM signal: Constant Amplitude Information is contained in D f (t). Instantaneous Phase: q (t). Define Phase Modulation Index, m p , to restrict D f ( t ) such that. Phase Deviation.

E N D
Angle Modulation: Phase Modulation or Frequency Modulation • Basic Form of FM signal: • Constant Amplitude • Information is contained in Df(t) Instantaneous Phase: q(t) Define Phase Modulation Index, mp, to restrict Df(t) such that Phase Deviation Total Instantaneous Phase Reference Phase Normalized Information Signal Df(t) = mpa(t)
Visualizing the FM Phasor . . .…down at the “Complex Plane” wc wc wc Reference Phasor Constant Amplitude FM Phasor Reference Phase Df(t) = mpa(t) Df(t) mp = |DfMAX|
Instantaneous Frequency Deviation Time Waveform: Phasor Notation: “Carrier Frequency” “Frequency Deviation” Instantaneous “Frequency Deviation” Can be very large and still have |a(t)| < 1 High rates of change implies Wide Bandwidth
Voltage Controlled Oscillator (VCO) “Free running” frequency fc (hz or R/s ) k0 (hz/v or R/s/v) VCO Deviation Sensitivity fout Phase Deviation: Df(t) k0 “Reference” phase Frequency deviation: Df(t) Frequency of VCO Output fc vin
FM Spectrum Now all we have to do is take the Fourier Transform of this thing . . . Spectral Analysis: High Math. Spectrum is characterized by spectral components spaced at +nwm from wc, with amplitudes determined by Bessel Functions Jn(mp). wm J1 J0 J2 J3 J4 wc
J0(m) J1(m) J2(m) J3(m) J4(m) J5(m) J6(m) J7(m) J8(m) J9(m) J10(m)
Bessel Function Tabulation The Bessel Function values determine the relative voltage amplitudes of their respective sidebands. The squares of the Bessel Function values determine the relative power amplitudes of their respective sidebands. For any value of m: If our Bandwidth includes N sidebands, then :