Download

1 / 1
10 likes | 202 Vues
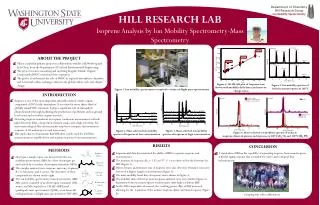
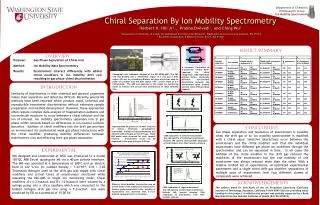
2a2. 2a1. 3 ion counts. 2a3. 2a4. 5 ion counts. 2a6. 2a5. 2a7. 2a8. Metabolomics By Ion Mobility Mass Spectrometry Prabha Dwivedi 1 ; Kimberly A. Kaplan 1 ; Thomas F. Egan 2 ; Agnes Tempez 2 ; Albert J. Schultz 2 ; and Herbert H. Hill Jr 1

E N D
2a2 2a1 3 ion counts 2a3 2a4 5 ion counts 2a6 2a5 2a7 2a8 Metabolomics By Ion Mobility Mass Spectrometry Prabha Dwivedi1; Kimberly A. Kaplan1; Thomas F. Egan2; Agnes Tempez2; Albert J. Schultz2; and Herbert H. Hill Jr1 1 Department of Chemistry & Center for Multiphase Environmental Research, Washington State University, Pullman, WA 99164; 2 Ionwerks Inc., Houston, TX RESULT SUMMARY RESULT SUMMARY RESULTS CONCLUSIONS OVERVIEW • Detection of ~850 metabolites along with simultaneous separation of ~250 isomeric metabolites was achieved by ESI-APIM-tof-MS. • Under identical experimental conditions measurement of metabolites in nM concentration range demonstrated a maximal standard deviation of 0.1 amu in mass to charge ratio, 0.05 ms in drift time and 0.02 cm2 V-1s-1 in reduced mobility value. • Extraction solvent and conditions effect the type and number of metabolites extracted. • Four fold increase in the peak capacity of the mass spectrometer alone was observed by interfacing it to IMS as a pre-separation technique in second dimension. • Results show that combined 2D information obtained by IMMS experiments can be applied as a powerful tool for separation and identification of metabolic features in complex matrices without performing extensive sample preparation. Purpose: Detection of metabolites in human blood Method: Ion Mobility Mass Spectrometry Results: Simultaneous detection of ~850 metabolitesand separation of ~250 isomers in human blood metabolome achieved 2D contour plots 1. of human blood metabolome (Left Top), 2. of an enlarged view in the m/z range of 190-225 amu showing the separation of isomers by IMS (Left Bottom), 3) of a close up view in the m/z range of 600-750 amu showing the application of ion mobility patterns to aid interpretation of peaks observed in an IMMS experiment (Right Top), and 4. demonstrating the IMMS peak shapes with 3 and 5 ion counts (Right bottom). INTRODUCTION Schematic of the ESI-APIMS-tofMS used for the analysis of human blood metabolome. Primary units in the instrument are: Ion source (ESI), heated atmospheric pressure desolvation region, Bradbury-Nielsen ion gate, Counter-flow atmospheric pressure drift region, differentially pumped interface, ion extraction region, orthogonal time-of-flight mass analyzer, and Bipolar MCP detector. Due to lack of efficient instrumental analytical techniques that can rapidly analyze complex biological samples and can provide sufficient visualization of the metabolome, currently an array of analytical methods is required for comprehensive analysis of a metabolome. In general, however, current analytical methods such as LC, GC, and CE, with or without MS require tedious sample preparation procedures prior to analysis and are normally suited for investigation only for a specific class of metabolites. Ion mobility spectrometry, with its resolving power comparable to that of GC; its sensitivity for the detection of analytes in nM concentrations; its high reproducibility in measurement, its compatibility for interfacing with GC, LC and MS; its application to compounds with diverse physical and chemical properties without extensive sample preparations; its separation selectivity for isomeric molecules, its durability and above all its short analysis time is a perfect analytical method for metabolomics. When used in tandem with MS, the ability to differentiate low intensity analyte peak from MS random noise by differentiation in mobility space allows detection of low abundance metabolites by IMS-MS. Density profile of metabolites detected in human blood metabolome by ESI-APIM-Tof-MS and with ion signals ≥ 5 ion counts. On the x-axis is shown the mass to charge ratio in amu and the y-axis represents the measured density in amu/Å3. Bar plot illustrating the distribution of number of metabolic features detected in cold and hot extraction methods with 5 averages and ion counts ≥ 5 ions. EXPERIMENTAL IMS used in this study was designed and constructed at WSU and interfaced to an orthogonal time of flight MS designed and constructed at Ionwerks Inc., Houston via a 250-µm pinhole interface. The IMS drift tube was operated at a temperature of 179oC and an electric field of 558 V/cm. Blood metabolites were extracted in methanol, ionized by ESI, size separated by IMS, mass separated by o-Tof-MS and detected by a bipolar MCP detector. Peak capacity: Illustration of the 2D space (shaded area in the X-Y quadrant) occupied by metabolites detected in human blood extract by ESI- APIM-Tof-MS with ≥ 5 ion counts. ACKNOWLEDGEMENTS 2D contour plots of the human blood metabolome in sections of ~100 amu This work was supported in part by a grant from National Institute of Health- Road Map Grant #R21-DK070274