Download
1 / 46
460 likes | 555 Vues
Market Insight Quarterly Chart Book. Fourth Quarter 2011 .

E N D
Market Insight Quarterly Chart Book Fourth Quarter 2011
The Quarterly Market Insight Chart Book is intended to provide unbiased context to the markets and economy.The Chart Book provides a factual framework to discuss the issues most relevant to investing using simple to understand charts of key data. The Chart Book can be helpful in addressing key topics such as economic growth in the United States and abroad, job growth, stock market valuations, corporate profits, inflation, monetary policy, commodity prices, and bond yields. This data is intended to help investors understand performance, recognize risks, and identify opportunities. There are two sections to the chart book. The main section features charts that will regularly appear in each quarterly edition. The second section features topical charts most relevant to the current environment that will vary from quarter-to-quarter.
Real Gross Domestic Product: Quantity Index (Percent Change From Prior Quarter, Annual Rate) % 8 4 0 -4 -8 -12 01 02 03 04 05 06 07 08 09 10 11 Source: Bureau of Economic Analysis /Haver Analytics 01/06/12 Gross Domestic Product (GDP) Growth Rate (Shaded area indicates recession) Gross Domestic Product (GDP) is the monetary value of all the finished goods and services produced within a country's borders in a specific time period, though GDP is usually calculated on an annual basis. It includes all of private and public consumption, government outlays, investments and exports less imports that occur within a defined territory. Tracking# 734362 Exp. (7/13)
China: Gross Domestic Product at Current Prices and Exchange Rates % Change - Year to Year Bil.US$ 30 25 20 15 10 5 96 97 98 99 00 01 02 03 04 05 06 07 08 09 10 Source: China National Bureau of Statistics/Haver Analytics 01/06/12 China: Gross Domestic Product (GDP) Growth (Shaded area indicates recession) International investing involves special risks, such as currency fluctuation and political instability, and may not be suitable for all investors. An emerging market is a nation that is progressing toward becoming advanced, as shown by some liquidity in local debt and equity markets and the existence of some form of market exchange and regulatory body. Gross Domestic Product (GDP) is the monetary value of all the finished goods and services produced within a country's borders in a specific time period, though GDP is usually calculated on an annual basis. It includes all of private and public consumption, government outlays, investments and exports less imports that occur within a defined territory. Tracking# 734366 Exp. (7/13)
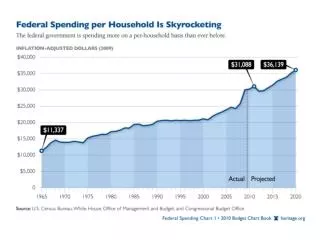
Federal Surplus/Deficit as Percentage of GDP Fiscal Year, % 2.5 0.0 -2.5 -5.0 -7.5 -10.0 65 70 75 80 85 90 95 00 05 10 Source: Office of Management and Budget /Haver Analytics 01/06/12 Budget Deficit Percent of Gross Domestic Product (GDP) (Shaded area indicates recession) Gross Domestic Product (GDP) is the monetary value of all the finished goods and services produced within a country's borders in a specific time period, though GDP is usually calculated on an annual basis. It includes all of private and public consumption, government outlays, investments and exports less imports that occur within a defined territory. Tracking# 734363 Exp. (7/13)
Civilian Unemployment Rate: 16 year + Seasonally Adjusted 12 10 8 6 4 2 50 55 60 65 70 75 80 85 90 95 00 05 10 Source: Bureau of Labor Statistics /Haver Analytics 01/06/12 Unemployment Rate (Shaded area indicates recession) The unemployment rate is the percentage of the total labor force that is unemployed but actively seeking employment and willing to work. Tracking# 734364 Exp. (7/13)
Change in Total Private Employment Seasonally Adjusted, Thousands 500 250 0 -250 -500 -750 -1000 01 02 03 04 05 06 07 08 09 10 11 Source: Bureau of Labor Statistics /Haver Analytics 01/06/12 Non-farm Job Growth (Shaded area indicates recession) Non-farm payroll employment is and economic indicator released by the U.S. Department of Labor. It is comprised of goods producing, construction and manufacturing companies. Tracking# 734365 Exp. (7/13)
Personal Income % Change - Year to Year Seasonally Adjusted Annual Rate, Bil.$ Personal Outlays % Change - Year to Year Seasonally Adjusted Annual Rate, Bil.$ 12 8 6 8 4 4 2 0 0 -4 -2 -8 -4 01 02 03 04 05 06 07 08 09 10 11 Sources: Bureau of Economic Analysis /Haver Analytics 01/06/12 Wages and/or Personal Income/Personal Spending (Shaded area indicates recession) Personal spending is the amount of expenses an individual has accounted for during the year. It includes mortgage payments, car payments, medical bills and shopping costs. Tracking# 734368 Exp. (7/13)
Existing 1-Family Home Sales: United States Seasonally Adjusted Annual Rate, Thous New 1-Family Houses Sold: United States Seasonally Adjusted Annual Rate, Thous 6750 1400 6000 1200 5250 1000 4500 800 3750 600 3000 400 2250 200 02 03 04 05 06 07 08 09 10 11 Sources: NAR, CENSUS /Haver 01/06/12 Home Sales (Shaded area indicates recession) Existing home sales is a measure of the number and price of sales of single-family homes other than new constructions. It is considered an economic indicator of the availability and affordability of mortgages and real estate in the United States. It is also considered a lagging indicator as it tends to react after changes in mortgage interest rates. Existing home sales tend to rise after a decline in mortgage rates and fall when the opposite happens. The U.S. National Association of Realtors publishes existing home sales monthly. Tracking# 734376 Exp. (7/13)
S&P/Case-Shiller Home Price Index: U.S. National % Change - Year to Year Not Seasonally Adjusted, Q1-00=100 20 10 0 -10 -20 90 95 00 05 10 Source: S&P, Fiserv, and MacroMarkets LLC /Haver Analytics 01/06/12 Home Prices (Shaded area indicates recession) The S&P/Chase-Shiller U.S. National Home Price Index tracks the growth in value of real estate by following the purchase price and resale value of homes that have undergone a minimum of two arm's-length transactions. The index is named for its creators, Karl Chase and Robert Shiller. Tracking# 734373 Exp. (7/13)
Light Weight Vehicle Sales {Autos+Light Trucks} Seasonally Adjusted Annual Rate, Mil. Units 22.5 20.0 17.5 15.0 12.5 10.0 7.5 90 95 00 05 10 Source: Bureau of Economic Analysis/Haver Analytics 01/06/12 Vehicle Sales (Shaded area indicates recession) Vehicle sales is the number of domestically produced units of cars, SUVs, minivans, and light trucks that are sold. These sales are reported on the first business day of the month. Tracking# 734374 Exp. (7/13)
Current Conditions Index (CCI) The Current Conditions Index is a weekly measure of the conditions that underpin our outlook for the markets and economy. The CCI provides real-time context and insight into the trends that shape our recommended actions to manage portfolios. This weekly index is not intended to be a leading index or predictive of where conditions are headed, but a coincident measure of where they are right now. We want to track the conditions in real-time to aid in investment decision making. Please see the weekly Current Conditions Index publication for specifics surrounding the make-up of the CCI. Tracking# 734375 Exp. (7/13)
Current Conditions Index (CCI) Components The Current Conditions Index (CCI) components are made up of 10 indicators that provided a weekly, real-time measure of the conditions in the economic and market environment. We standardized these components compared to their pre-crisis 10-year average, equally weighted their standardized scores, and aligned the resulting index with zero at the start of 2009. These components capture how the conditions are evolving from a wide range of angles. Each component is important and measures a different driver of the environment. Please see the weekly Current Conditions Index publication for specifics surrounding the make-up of the CCI. Tracking# 734379 Exp. (7/13)
CPI-U: All Items % Change - Year to Year Seasonally Adjusted, 1982-84=100 CPI-U: All Items Less Food and Energy % Change - Year to Year Seasonally Adjusted, 1982-84=100 16 12 8 4 0 -4 65 70 75 80 85 90 95 00 05 10 Sources: Bureau of Labor Statistics /Haver Analytics 01/06/12 Consumer Price Index (CPI) (Shaded area indicates recession) The Consumer Price Index (CPI) is a measure of the average change over time in the prices paid by urban consumers for a market basket of consumer goods and services. Tracking#734382 Exp. (07/13)
KR-CRB Spot Commodity Price Index: All Commodities 1967=100 600 500 400 300 200 90 95 00 05 10 Source: Commodity Research Bureau /Haver Analytics 01/06/12 Commodity Prices (Shaded area indicates recession) The CRB Index is an unmanaged index, which cannot be invested into directly. Past performance is no guarantee of future results. The Commodity Research Bureau (CRB) Index is an index that measures the overall direction of commodity sectors. The CRB was designed to isolate and reveal the directional movement of prices in overall commodity trades. The fast price swings in commodities and currencies will result in significant volatility in an investor's holdings. Tracking# 734380 Exp. (07/13)
ISM Manufacturing: PMI Composite Index Seasonally Adjusted, 50+=Increasing 75 70 65 60 55 50 45 40 35 30 25 90 95 00 05 10 Source: Institute for Supply Management /Haver Analytics 01/06/12 Institute for Supply Management (ISM) Index (Shaded area indicates recession) The ISM index is based on surveys of more than 300 manufacturing firms by the Institute of Supply Management. The ISM Manufacturing Index monitors employment, production inventories, new orders, and supplier deliveries. A composite diffusion index is created that monitors conditions in national manufacturing based on the data from these surveys. Purchasing Managers Index (PMI) is an indicator of the economic health of the manufacturing sector. The PMI index is based on five major indicators: new orders, inventory levels, production, supplier deliveries and the employment environment. Tracking# 734381 Exp. (07/13
University of Michigan: Consumer Sentiment Not Seasonally Adjusted, Q1-66=100 120 100 80 60 40 90 95 00 05 10 Source: University of Michigan /Haver Analytics 01/06/12 Consumer Sentiment (Shaded area indicates recession) The University of Michigan Consumer Sentiment Index (MCSI) is a survey of consumer confidence conducted by the University of Michigan. The Michigan Consumer Sentiment Index (MCSI) uses telephone surveys to gather information on consumer expectations regarding the overall economy. Tracking# 734383 Exp. (07/13)
Federal Open Market Committee: Fed Funds Target Rate % 10 8 6 4 2 0 90 95 00 05 10 Source: Haver Analytics 01/06/12 Federal Funds Rate with Futures Implied Rates Going Out One Year (Shaded area indicates recession) The Federal Funds Rate is the interest rate at which a depository institution lends immediately available funds (balances at the Federal Reserve) to another depository institution overnight. Tracking# 734384 Exp. (07/13)
All Fed Res Banks: Total Assets End Of Period, Bil.$ 3000 2500 2000 1500 1000 500 0 90 95 00 05 10 Source: Federal Reserve Board /Haver Analytics 01/06/12 Federal Reserve (Fed) Balance Sheet (Shaded area indicates recession) The Federal Reserve Balance Sheet is the breakdown of the assets and liabilities held by the Federal Reserve. Tracking# 734388 Exp. (07/13)
$120 $100 $80 $60 $40 $20 $0 S&P 500 EPS Historical & Estimates for the Next Four Quarters 1990 1992 1994 1996 1998 2000 2002 2004 2006 2008 2010 2012 Source: LPL Financial, Thomson Financial, Bloomberg data 1/4/12 The S&P 500 is an unmanaged index, which cannot be invested into directly. Past performance is no guarantee of future results. The Standard & Poor’s 500 Index is a capitalization-weighted index of 500 stocks designed to measure performance of the broad domestic economy through changes in the aggregate market value of 500 stocks representing all major industries. Earnings per share (EPS) is the portion of a company's profit allocated to each outstanding share of common stock. EPS serves as an indicator of a company's profitability. Earnings per share is generally considered to be the single most important variable in determining a share's price. It is also a major component used to calculate the price-to-earnings valuation ratio. Tracking# 734389 Exp. (07/13)
Historical S&P 500 PE Ratio Trailing & Forward Source: LPL Financial, Thomson Financial, Bloomberg data 1/4/12 The S&P 500 is an unmanaged index, which cannot be invested into directly. Past performance is no guarantee of future results. The Standard & Poor’s 500 Index is a capitalization-weighted index of 500 stocks designed to measure performance of the broad domestic economy through changes in the aggregate market value of 500 stocks representing all major industries. The P/E ratio (price-to-earnings ratio) is a measure of the price paid for a share relative to the annual net income or profit earned by the firm per share. It is a financial ratio used for valuation: a higher P/E ratio means that investors are paying more for each unit of net income, so the stock is more expensive compared to one with lower P/E ratio. Tracking# 734387 Exp. (07/13)
Outlook May Be Brightening for Long-Term Investors Source: LPL Financial, Thomson Financial, Bloomberg 1/4/12 The S&P 500 is an unmanaged index, which cannot be invested into directly. Past performance is no guarantee of future results. The P/E ratio (price-to-earnings ratio) is a measure of the price paid for a share relative to the annual net income or profit earned by the firm per share. It is a financial ratio used for valuation: a higher P/E ratio means that investors are paying more for each unit of net income, so the stock is more expensive compared to one with lower P/E ratio. Tracking #1-011519 Exp. (07/13)
Bonds May Offer Poor Returns to Investors Source: LPL Financial, Ibbotson Associates, Bloomberg 1/4/12 Government bonds and Treasury Bills are guaranteed by the U.S. government as to the timely payment of principal and interest and, if held to maturity, offer a fixed rate of return and fixed principal value. However, the value of a fund shares is not guaranteed and will fluctuate. Bonds are subject to market and interest rate risk if sold prior to maturity. Bond values and yields will decline as interest rates rise and bonds are subject to availability and change in price. Tracking #1-011506 Exp. (10/13)
High Yield Bond Spreads & Default Rate Source: Barclays, Moodys, LPL Financial 1/5/12 All Indices are unmanaged and cannot be invested into directly. High yield/junk bonds (grade BB or below) are not investment grade securities, and are subject to higher interest rate, credit, and liquidity risks than those graded BBB and above. They generally should be part of a diversified portfolio for sophisticated investors. Bonds are subject to market and interest rate risk if sold prior to maturity. Bond values will decline as interest rates rise and are subject to availability and change in price. High-Yield spread is the yield differential between the average yield of high-yield bonds and the average yield of comparable maturity Treasury bonds. The Default Rate This rate can be used in reference to two main things: The rate of borrowers who fail to remain current on their loans. It is a critical piece of information used by lenders to determine their risk exposure and economists to evaluate the health of the overall economy. And, The interest rate charged to a borrower when payments on a revolving line of credit are overdue. This higher rate is applied to outstanding balances in arrears in addition to the regular interest charges for the debt. Tracking# 734390 Exp. (7/13)
10-Year Treasury Note Yield at Constant Maturity Real Yield Avg,% 6.00 3.75 3.00 5.25 2.25 4.50 1.50 3.75 0.75 3.00 0.00 2.25 -0.75 1.50 02 03 04 05 06 07 08 09 10 11 02 03 04 05 06 07 08 09 10 11 Source: U.S. Treasury /Haver Analytics 01/06/12 Source: Haver Analytics 01/06/12 10-year Treasury yield & 10-year Treasury Yield Minus Core Consumer Price Index (CPI) Period Average (Shaded area indicates recession) The Consumer Price Index (CPI) is a measure of the average change over time in the prices paid by urban consumers for a market basket of consumer goods and services. Government bonds and Treasury Bills are guaranteed by the U.S. government as to the timely payment of principal and interest and, if held to maturity, offer a fixed rate of return and fixed principal value. However, the value of a fund shares is not guaranteed and will fluctuate. Tracking# 734391 Exp. (7/13)
BAML Corporate Master Index to Treasury Master Index BofAML Merrill Lynch Corporate Master: Yield to Maturity Yield to Maturity Spread % 8 10 6 8 4 6 2 4 0 2 00 01 02 03 04 05 06 07 08 09 01 02 03 04 05 06 07 08 09 10 11 Source: Haver Analytics 01/06/12 Source: Bank of America Merrill Lynch /Haver Analytics 01/06/12 Investment-Grade Corporate Spread & Yield Source: FactSet 07/0811 Bonds are subject to market and interest rate risk if sold prior to maturity. Bond values will decline as interest rates rise and are subject to availability and change in price. Corporate bonds are considered higher risk than government bonds but normally offer a higher yield and are subject to market, interest rate and credit risk as well as additional risks based on the quality of issuer coupon rate, price, yield, maturity and redemption features. High-Yield spread is the yield differential between the average yield of high-yield bonds and the average yield of comparable maturity Treasury bonds. Tracking# 734392 Exp. (7/13)
Emerging Market Debt (EMD) Spread & Yield Source: FactSet 1/5/12 The Barclays Global EM Bond Index is unmanaged and cannot be invested into directly. Past performance is no guarantee of future results. International and emerging markets investing involves special risks such as currency fluctuation and political instability and may not be suitable for all investors. High-Yield spread is the yield differential between the average yield of high-yield bonds and the average yield of comparable maturity Treasury bonds. Yield is the income return on an investment. This refers to the interest or dividends received from a security and is usually expressed annually as a percentage based on the investment's cost, its current market value or its face value. Tracking# 734393 Exp. (7/13)
30-year AAA Municipal Yield as a Percentage of Treasuries 225 200 175 150 125 100 75 02 03 04 05 06 07 08 09 10 11 Source: Haver Analytics 01/06/12 30-year Municipal Yields as a Percentage of Treasuries (Shaded area indicates recession) Municipal bonds are subject to availability, price, and to market and interest rate risk if sold prior to maturity. Bond values will decline as interest rate rise. Interest income may be subject to the alternative minimum tax. Federally tax-free but other state and local taxes may apply. Bonds are subject to market and interest rate risk if sold prior to maturity. Bond values will decline as interest rates rise and are subject to availability and change in price. Government bonds and Treasury Bills are guaranteed by the U.S. government as to the timely payment of principal and interest and, if held to maturity, offer a fixed rate of return and fixed principal value. However, the value of a fund shares is not guaranteed and will fluctuate. An obligation rated 'AAA' has the highest rating assigned by Standard & Poor's. The obligor's capacity to meet its financial commitment on the obligation is extremely strong. Tracking# 734394 Exp. (7/13)
Nominal Trade-Weighted Exch Value of US$ vs Major Currencies Mar-73=100 160 140 120 100 80 60 75 80 85 90 95 00 05 10 Source: Federal Reserve Board /Haver Analytics 01/06/12 Trade Weighted Dollar (Shaded area indicates recession) Trade weighted dollar is a representation of the foreign currency price of the US dollar or the export value of the US dollar. Tracking# 734395 Exp. (7/13)
ECRI Weekly Leading Index 1992=100 160 140 120 100 80 90 95 00 05 10 Source: Haver Analytics 01/06/12 Leading Economic Indicators (Shaded area indicates recession) ECRI's Weekly Leading Index (WLI) is a composite index constructed of seven USA weekly economic series (M2, JOC-ECRI industrial materials price index, initial unemployment insurance claims, mortgage applications, S&P 500, 10-yr Treasury bond yield, and bond quality spread). The limited availability of weekly data constrains the number of variables in the composite index, but this has not hurt the WLI's predictive power. Tracking# 734396 Exp. (7/13)
Treasury & Muni Yield Curves Source: Factset 1/5/12 An obligation rated 'AAA' has the highest rating assigned by Standard & Poor's. The obligor's capacity to meet its financial commitment on the obligation is extremely strong. Municipal bonds are subject to availability, price, and to market and interest rate risk if sold prior to maturity. Bond values will decline as interest rate rise. Interest income may be subject to the alternative minimum tax. Federally tax-free but other state and local taxes may apply. Government bonds and Treasury Bills are guaranteed by the U.S. government as to the timely payment of principal and interest and, if held to maturity, offer a fixed rate of return and fixed principal value. However, the value of a fund shares is not guaranteed and will fluctuate. Bonds are subject to market and interest rate risk if sold prior to maturity. Bond values will decline as interest rates rise and are subject to availability and change in price. Yield Curve is a line that plots the interest rates, at a set point in time, of bonds having equal credit quality, but differing maturity dates. The most frequently reported yield curve compares the three-month, two-year, five-year and 30-year U.S. Treasury debt. This yield curve is used as a benchmark for other debt in the market, such as mortgage rates or bank lending rates. The curve is also used to predict changes in economic output and growth. Tracking# 734397 Exp. (7/13)
Main Street’s assessment of the economy in the Fed’s Beige Book Suggests the Economy Has Come a Long Way Since 2009 Source: Federal Reserve Board 1/6/12 The Beige Book is a commonly used name for the Fed report called the Summary of Commentary on Current Economic Conditions by Federal Reserve District. It is published just before the FOMC meeting on interest rates and is used to inform the members on changes in the economy since the last meeting. Tracking #1-035448 Exp. (1/14)
A Recession of Confidence Job Recovery Since Low in 2010 in line with Past Recoveries Source: LPL Financial, Bloomberg data 1/4/12 Please note, chart represents both private and public sector jobs. Tracking #1-011509 Exp. (10/13)
A Recession of Confidence (left scale) (right scale) Source: LPL Financial, Bloomberg data 1/4/12 The index of leading economic indicators (LEI) is an economic variable, such as private-sector wages, that tends to show the direction of future economic activity Tracking # 1-011510 Exp. (10/13)
The Federal Reserve’s Next Steps Quantitative Easing is a government monetary policy occasionally used to increase the money supply by buying government securities or other securities from the market. Quantitative easing increases the money supply by flooding financial institutions with capital in an effort to promote increased lending and liquidity. The Federal Open Market Committee action known as Operation Twist began in 1961. The intent was to flatten the yield curve in order to promote capital inflows and strengthen the dollar. The Fed utilized open market operations to shorten the maturity of public debt in the open market. The action has subsequently been reexamined in isolation and found to have been more effective than originally thought. As a result of this reappraisal, similar action has been suggested as an alternative to quantitative easing by central banks. Mortgage-Backed Securities are subject to credit, default risk, prepayment risk that acts much like call risk when you get your principal back sooner than the stated maturity, extension risk, the opposite of prepayment risk, and interest rate risk. Government bonds and Treasury Bills are guaranteed by the U.S. government as to the timely payment of principal and interest and, if held to maturity, offer a fixed rate of return and fixed principal value. However, the value of a fund shares is not guaranteed and will fluctuate. Tracking #1-013916 Exp. (10/13)
European 10-Year Bond Yields 0% 7% 14% 21% 28% Greece Portugal 12.4% Ireland 7.8% Italy 7.0% Spain 5.6% Poland 5.9% Belgium 4.5% Czech Rep 3.6% Austria 3.3% France 3.3% Finland 2.3% Netherlands 2.2% Norway 2.1% UK 2.1% Germany 1.9% Denmark 1.6% Sweden 1.7% Switzerland 0.6% Source: LPL Financial, International Monetary Fund World Economic Outlook Database, September 2011 Past performance is no guarantee of future results. Bonds are subject to market and interest rate risk if sold prior to maturity. Bond values and yields will decline as interest rates rise and bonds are subject to availability and change in price. Investing in foreign securities involves special additional risks. These risks include, but are not limited to, currency risk, political risk, and risk associated with varying accounting standards. Investing in emerging markets may accentuate these risks. Tracking #1-034576 Exp. (1/14)
Emerging Market Economies Percent of World Gross Domestic Product (GDP) Hits 50% in 2012 Non-Advanced Economy GDP on Purchasing Power Parity (PPP) Share of World Total with International Monetary Fund Projections Source: LPL Financial, International Monetary Fund World Economic Outlook Database, September 2011 Purchasing Power Parity (PPP) is an economic theory that estimates the amount of adjustment needed on the exchange rate between countries in order for the exchange to be equivalent to each currency's purchasing power. Tracking #1-034575 Exp. (1/14)
The Year of the Cliché Source: LPL Financial, Bloomberg data 1/4/12 The S&P 500 is an unmanaged index, which cannot be invested into directly. Past performance is no guarantee of future results. Tracking # 1-011528 Exp. (1/13
Stock Market Tracking Economic, Rather Than European, Developments (right scale) (left scale) Source: LPL Financial, Bloomberg Data 1/4/12 The S&P 500 is an unmanaged index, which cannot be invested into directly. Past performance is no guarantee of future results. Initial Jobless Claims is a measure of the number of jobless claims filed by individuals seeking to receive state jobless benefits. This number is watched closely by financial analysts because it provides insight into the direction of the economy. Higher initial claims correlate with a weakening economy. Tracking #1-034571 Exp. (1/13)
Recent Presidential Year Performance S&P 500 Performance in Past Five Presidential Years 4th Quarter Source: LPL Financial, Bloomberg Data 1/9/09 The S&P 500 is an unmanaged index, which cannot be invested into directly. Past performance is no guarantee of future results. The Standard & Poor’s 500 Index is a capitalization-weighted index of 500 stocks designed to measure performance of the broad domestic economy through changes in the aggregate market value of 500 stocks representing all major industries. Tracking # 1-034568 Exp. (1/13)
LPL Financial Research Predicted Earnings Growth Closely Tracks the Actual Earnings Actual Earnings Growth LPL Financial Research Predicted Earnings Growth Forecast Source: LPL Financial, Thomas Financial 11/21/11 This expectation is supported by our model of earnings growth using key drivers of earnings as inputs: commodity prices, the yield curve, labor costs and global leading economic indicators. The S&P 500 is an unmanaged index, which cannot be invested into directly. Past performance is no guarantee of future results. The Standard & Poor’s 500 Index is a capitalization-weighted index of 500 stocks designed to measure performance of the broad domestic economy through changes in the aggregate market value of 500 stocks representing all major industries. Tracking #1-034566 Exp. (1/13)
In 2012, Europe’s Ability to Rollover Maturing Debt Will be a Key Test for Financial Markets Source: Bloomberg, LPL Financial 1/5/12 Note: European Bank debt profile consists of maturing debt of 11 large European banks (Deutsche Bank, Commerzbank, BNP, Credit Agricole, Societe Generale, Banco Santander, Banco Bilbao, Banco Popular, Unicredito, Intesa San Paolo, and Monte dei Paschi. Tracking #1-034573 Exp. (1/13)
2011 Market Moving Events: S&P 500 Timeline In addition to traditional market-specific drivers, economic, regulatory, and political factors all influenced the direction of the stock market in 2011 Source: Bloomberg, LPL Financial 12/31/11 The Standard & Poor’s 500 Index is a capitalization-weighted index of 500 stocks designed to measure performance of the broad domestic economy through changes in the aggregate market value of 500 stocks representing all major industries. The S&P 500 is an unmanaged index, which cannot be invested into directly. Past performance is no guarantee of future results. Tracking #1-036018 Exp. (1/13)
Important Disclosure The opinions voiced in this material are for general information only and are not intended to provide or be construed as providing specific investment advice or recommendations for any individual. To determine which investments may be appropriate for you, consult your financial advisor prior to investing. All performance referenced is historical and is no guarantee of future results. All indices are unmanaged and cannot be invested into directly. This research material has been prepared by LPL Financial. The LPL Financial family of affiliated companies includes LPL Financial and UVEST Financial Services Group, Inc., each of which is a member of FINRA/SIPC. To the extent you are receiving investment advice from a separately registered independent investment advisor, please note that LPL Financial is not an affiliate of and makes no representation with respect to such entity. Tracking# 742279| Exp. (7/13)