Download
1 / 54
540 likes | 703 Vues
Bio E101 Genomics and Computational Biology. Tue Sep 19 DNA 1: Life & computers; comparative genomics, databases; model utility Tue Sep 26 DNA 2: Polymorphisms, populations, statistics, pharmacogenomics Tue Oct 03 DNA 3: Dynamic programming, Blast, Multi-alignment, HiddenMarkovModels

E N D
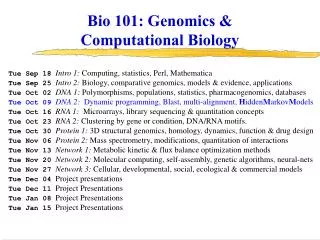
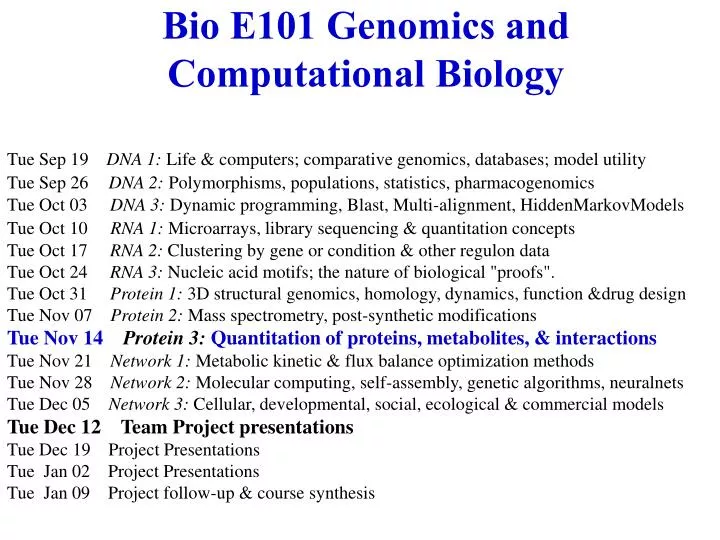
Bio E101 Genomics and Computational Biology Tue Sep 19 DNA 1: Life & computers; comparative genomics, databases; model utility Tue Sep 26DNA 2:Polymorphisms, populations, statistics, pharmacogenomics Tue Oct 03 DNA 3: Dynamic programming, Blast, Multi-alignment, HiddenMarkovModels Tue Oct 10 RNA 1: Microarrays, library sequencing & quantitation concepts Tue Oct 17 RNA 2: Clustering by gene or condition & other regulon data Tue Oct 24 RNA 3: Nucleic acid motifs; the nature of biological "proofs". Tue Oct 31 Protein 1: 3D structural genomics, homology, dynamics, function &drug design Tue Nov 07 Protein 2: Mass spectrometry, post-synthetic modifications Tue Nov 14Protein 3:Quantitation of proteins, metabolites, & interactions Tue Nov 21 Network 1: Metabolic kinetic & flux balance optimization methods Tue Nov 28 Network 2: Molecular computing, self-assembly, genetic algorithms, neuralnets Tue Dec 05 Network 3: Cellular, developmental, social, ecological & commercial models Tue Dec 12 Team Project presentations Tue Dec 19 Project Presentations Tue Jan 02 Project Presentations Tue Jan 09 Project follow-up & course synthesis
Pro2: Last week's take home lessons • Separation of proteins & peptides • Why & How • Protein localization & complexes • Peptide identification (MS/MS) • Database searching & sequencing. • Protein quantitation • Absolute & relative • Protein modifications & crosslinking
Network genomics Environment Metabolites Interactions RNA DNA Protein Growth rate Expression stem cells cancer cells microbes
Pro3: Today's story & goalsBio101 14-Nov-2000 • Protein interactions with proteins • SNPs to morphology & pathology • Quantitation of metabolites • Concentrations & fluxes • Protein interactions with small molecules • Binding & catalysis • Basic types of models • Effects on morphology & physiology
Protein interactions with proteins Crosslinking (101Pro2) MIPS, YPD & bibliometrics (Pub) Two hybrid interaction screens Uetz et al. Nature 2000, 403:623-7 A comprehensive analysis of protein-protein interactions in Saccharomyces cerevisiae. 957 putative interactions involving 1,004 of the 6,000 S. cerevisiae proteins tested. (Pub)
Red Blood Cell Function • Transport O2 from lungs to tissues – using hemoglobin to carry the O2 • Hemoglobin is maintained in its functional state (reduced) by the metabolic machinery • Cell membrane separates the internal environment from the external environment • subject to physicochemical constraints • Electroneutrality, Osmotic balance • Cause of the imbalance: • impermeable polyions inside the cell • hemoglobin, organic phosphates
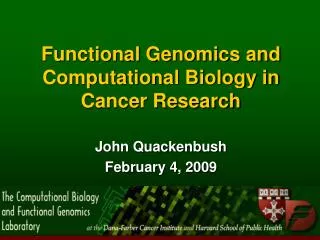
Sickle cell Average HbSbE6VHbbE6W Modeling SNP to 3D to cell morphology & pathology Harrington et al. Crystal structure of deoxy-human hemoglobin b6 Glu --> Trp. Implications for the structure and formation of the sickle cell fiber. J Biol Chem. 1998, 273:32690-6. (Pub)
Pro3: Today's story & goalsBio101 14-Nov-2000 • Protein interactions with proteins • SNPs to morphology & pathology • Quantitation of metabolites • Concentrations & fluxes • Protein interactions with small molecules • Binding & catalysis • Basic types of models • Effects on morphology & physiology
3D-structure to function to morphology to function Normal RBC 6-8 µm; 4e12 per L Sickle cell; HbS Dacrocytes; pernicious anemia Acanthocytes; abetalipoproteinemia Echinocytes (crenated); hyperosmotic medium Macrocytes 9-12µm; megaloblastic anemia Spherocytes; enzyme deficiencies www.wadsworth.org/chemheme/heme/cytocritique
From SNPs to pathogen resistance mechanisms "Model...erythrocytes of [glutathione peroxidase] GPX1*2 heterozygotes should be more efficient in sheltering the cell membrane from irreversible oxidation and binding of hemoglobin caused by the oxidant stress exerted by Plasmodium falciparum... we observed a clear trend toward a dissociation between the HBB*A/*S and GPX1*2/*1 genotypes in the overall data." Destro-Bisol et al. Hum Biol 1999; 71:315-32. (Pub)
From SNPs to toxicology mechanisms "Drug-induced [e.g. primaquine] oxidative hemolysis ... with certain enzymopathies, notably glucose-6-phosphate dehydrogenase deficiency... Others ... disrupt mitochondrial function and ... heme biosynthesis ... including ... alcohol & chloramphenicol" Ammus & Yunis, Blood Rev 1989;3:71-82, Drug-induced red cell dyscrasias. (Pub)
Pro3: Today's story & goalsBio101 14-Nov-2000 • Protein interactions with proteins • SNPs to morphology & pathology • Quantitation of metabolites • Concentrations & fluxes • Protein interactions with small molecules • Binding & catalysis • Basic types of models • Effects on morphology & physiology
Challenges for accurately measuring metabolites • Rapid kinetics • Rapid changes during isolation • Idiosyncratic detection methods: • enzyme-linked, GC, LC, NMR • (albeit fewer molecular types than RNA& protein)
Databases Y= 598 have identical mass e.g. Ile & Leu = 131.17 160 240 X = Mass Karp et al. (1998) NAR 26:50. EcoCyc; Selkov, et al. (1997) NAR 25:37. WIT Ogata et al. (1998) Biosystems 47:119-128 KEGG
Y= RPLCretentiontimein min.(higherhydro-phocity) X = Mass I L W
Wunschel J Chromatogr A 1997, 776:205-19 Quantitative analysis of neutral & acidic sugars in whole bacterial cell hydrolysates using high-performance anion-exchange LC-ESI-MS2. (Pub) Metabolite fragmentation & stable isotope labeling
Isotopomers Measures flux. Why use proteins rather than metabolites directly? Klapa et al. Biotechnol Bioeng 1999; 62:375-391. Metabolite and isotopomer balancing in the analysis of metabolic cycles: I. Theory. (Pub) "accounting for the contribution of all pathways to label distribution is required, especially ... multiple turns of metabolic cycles...following the administration of 13C (or 14C) labeled substrates." Sauer J et al. Bacteriol 1999;181:6679-88 Metabolic flux ratio analysis of genetic and environmental modulations of Escherichia coli central carbon metabolism. (Pub)
Pro3: Today's story & goalsBio101 14-Nov-2000 • Protein interactions with proteins • SNPs to morphology & pathology • Quantitation of metabolites • Concentrations & fluxes • Protein interactions with small molecules • Binding & catalysis • Basic types of models • Effects on morphology & physiology
Types of interaction models Quantum Electrodynamics subatomic Quantum mechanics electron clouds Molecular mechanics spherical atoms (101Pro1) Master equations stochastic single molecules (Net1) Phenomenological rates ODE Concentration & time (C,t) Flux Balance dCik/dt optima steady state (Net1) Thermodynamic models dCik/dt = 0 k reversible reactions Steady State SdCik/dt = 0 (sum k reactions) Metabolic Control Analysis d(dCik/dt)/dCj (i = chem.species) Spatially inhomogenous models dCi/dx Increasing scope, decreasing resolution
Metabolic Control Analysis (MCA) • Elasticity: how an enzyme’s rate varies with the concentration of a metabolite (Substrate elasticities approach infinity for reactions close to equilibrium) • Control coefficient is the system property of an enzyme that expresses how any system variable, usually a flux or a metabolite concentration, depends on the activity of the enzyme. • Response coefficient defines the sensitivity of any system variable to any perturbation.
In vivo &(classical) in vitro 1) "Most measurments in enzyme kinetics are based on initial rate measurements, where only the substrate is present… enzymes in cells operate in the presence of their products" Fell p.54 (Pub) 2) Enzymes & substrates are closer to equimolar than in classical in vitro experiments. 3) Proteins close to crystalline densities so some reactions occur faster while some normally spontaneous reactions become undetectably slow. E.g. Bouffard, et al., Dependence of lactose metabolism upon mutarotase encoded in the gal operon in E.coli. J Mol Biol. 1994; 244:269-78. (Pub)
E A EA EB B How do enzymes & substrates formally differ? ATP E2+P ADP E EATP EP Catalysts increase the rate (&specificity) without being consumed.
Enzyme rate equations with one Substrate & one Product E S P dP/dt =V (S/Ks - P/K) 1 + S/Ks + P/Kp As P approaches 0: dP/dt= V 1+ Ks/S S
Approach to studying behavior of defined genotypes … Subject them to governing constraints and then analyze biological properties within the applicable constraints
Factors Constraining Metabolic Function • Physicochemical factors • Mass, energy, and redox balance: • Systemic stoichiometry • osmotic pressure, electroneutrality, solvent capacity, molecular diffusion, thermodynamics • Non-adjustable constraints • System specific factors • Capacity: • Maximum fluxes • Rates: • Enzyme kinetics • Gene Regulation • Adjustable constraints
Dynamic Description • Dynamic mass balances on each metabolite • Sum of rates of formation, degradation, utilization, and transport • Vtrans, uptake or secretion of metabolite across the cell membrane • Vsyn, Synthesis of the metabolite • Vuse, consumption of cellular constituents or maintenance requirements • Vdeg, degradation of metabolite Vtrans Vdeg Vsyn Vuse
Dynamic Description • Typically, the uptake and secretion rates are known. • More formally, one can write • Where vj is the jth reaction rate, Sij is the moles of metabolite i produced in reaction j • This is typically written in matrix form
Dynamic Description • the time derivatives of the metabolite concentrations as a linear combination of the reaction rates. • The reaction rates are highly non-linear functions of the metabolite concentrations. • Thus, the equations are difficult to formulate • The equations are difficult to solve
Stoichiometric Matrix • The matrix, S, is very important in metabolic dynamics. • It maps the reaction rates into the rates of change of metabolites. • m x n matrix. The number of columns n (reactions) often exceeds the number of rows m (metabolites)
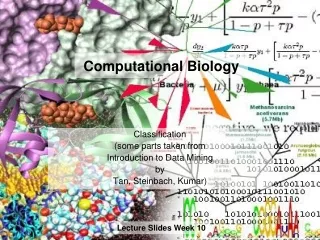
Human Red Blood CellMetabolism ADP ATP 1,3 DPG NADH 3PG NAD GA3P 2PG 2,3 DPG FDP DHAP ADP PEP ATP ADP F6P ATP PYR R5P GA3P F6P NADH G6P GL6P GO6P RU5P NAD LACi LACe X5P S7P E4P ADP NADP NADP NADPH NADPH ATP GLCe GLCi Cl- 2 GSH GSSG GA3P F6P ADP K+ NADPH NADP pH ATP Na+ ADP HCO3- ADO AMP ADE ADP ATP PRPP INO IMP ATP ADOe AMP PRPP ATP INOe R5P R1P ADEe HYPX
2,3 DPG RBC Metabolic “Machinery” Glucose Transmembrane Pumps ATP Nucleotide Metabolism Maintenance & Repair Glycolysis PPP Oxidants Hb Met Hb NADH 2,3 DPG Pyruvate Lactate
RBC model integration Reference Glyc- PPP ANM Na+/K+ Osmot. Trans- Hb-5 Gpx Shape olysis Pump port ligands Hb Ca Rapoport ’74-6+ - - - - - - - - - Heinrich ’77 + - - - - - - - - - Ataullakhanov’81 ++ - - - - - - - - Schauer ’81 + - + - - - - - - - Brumen ’84 + - - ++ - - - - - Werner ’85 + - - +++ - - - - Joshi ’90 + + + + + + - - - - Yoshida ’90 - - - - - - + - - - Lee ’92 + + + + + + (+) - - - Gimsa ’98 - - - - - - - - - + Destro-Bisol ‘99 - - - - - - - (-) - - Jamshidi ’00+ + + + + + - - - -
Scopes & Assumptions • Mechanism of ATP utilization other than nucleotide metabolism and the Na+/K+ pump (75%) is not specifically defined • Ca2+ transport not included • Guanine nucleotide metabolism neglected • little information, minor importance • Cl-, HCO3-, LAC, etc. are in “pseudo” equilibrium • No intracellular concentration gradients • Rate constants represent a “typical cell” • Surface area of the membrane is constant • Environment is treated as a sink
Glycolysis Dynamic Mass Balances Rapoport-Leubering shunt
Enzyme Kinetic Expressions Phosphofructokinase
Kinetic Expressions • All rate expressions are similar to the previously shown rate expression for phosphofructokinase. • Model has 44 rate expressions with ~ 5 constants each ~ 200 parameters • What are the assumptions associated with using these expressions?
Kinetic parameter assumptions • in vitro values represent the in vivo parameters • protein concentration in vitro much lower than in vivo • enzyme interactions (enzymes, cytoskeleton, membrane, …) • pH; what does intracellular pH mean? • pH = 7 [H+] = 0.1 mM • 1 to 60 protons in a bacterial cell; 57,000 protons in the RBC • samples used to measure kinetics may contain unknown conc. of effectors (i.e. fructose 2,6-bisphosphate) • enzyme catalyzed enzyme modifications • all possible concentrations of interacting molecules been considered (interpolating) • e.g. glutamine synthase (unusually large # of known effectors) • 3 substrates, 3 products, 9 significant effectors • 415 (~109) measurements: 4 different conc. of 15 molecules (Savageau, 1976) • in vivo probably even more complex, but approximations are effective. • have all interacting molecules been discovered? • and so on …
Additional constraints:Physicochemical constrains Osmotic Pressure Equilibrium (interior & exterior, m chem. species) Electroneutrality (z = charge, Concentration)
Met in silico in vivo G6P 0.0564 0.038±0.012 F6P 0.0231 0.016±0.003 FDP 0.0126 0.0076±0.004 DHAP 0.1411 0.140±0.004 GA3P 0.0064 0.0067±0.012 1,3 DPG 0.000226 0.0004 3PG 0.0846 0.045 2PG 0.0124 0.014±0.005 PEP 0.0211 0.017±0.002 PYR 0.060 0.077±0.05 LAC 1.378 1.1±0.5 2,3 DPG 4.62 4.5±0.5 NADH 0.0303 ADO 0.0000513 0.0012±0.0003 AMP 0.136 0.08±0.009 ADP 0.391 0.27±0.12 ATP 1.870 1.54±0.25 Met in silico in vivo (mM) GL6P 0.00175 GO6P 0.0317 NADPH 0.0655 0.0658 GSH 3.312 3.21±1.5 RU5P 0.00457 R5P 0.0117 X5P 0.0137 S7P 0.021 E4P 0.0049 PRPP 0.0117 0.005±0.001 IMP 0.0180 0.010 INO 0.000043 0.001 HX 0.00023 0.002 R1P 0.0011 0.060 Ki 136.9 135.0±10.0 Nai 14.2 10.0±6.00 Steady State Concentrations:in silico vs. in vivo
RBC steady-state in vivo vs calculated |obs-calc| = Y sd(obs) X= metabolites (ordered by Y)
0.1 hour dynamics ODE model Jamshidi et al. 2000 (Pub) Human RBC
1.0 hour dynamics Human RBC
10 hours dynamics Human RBC
Enzyme Kinetic Expressions Phosphofructokinase
A K DA = K = K DB B A Circular motion Return to steady state B Phase plane diagrams: concentration of metabolite A vs B over a specific time course 1 2 3 4 1: conservation relationship. 2: a pair of concentrations in equilibrium 3: two dynamically independent metabolites 4: a closed loop trace
1 hours 300 hours ATP & Redox loads ATP load Red 0 hours Green 0.1 Blue 1.0 Yellow 10 End 300 Redox load
RedoxLoad 0 to 300 hour dynamics 34 metabolites calculated
Pro3: Today's story & goalsBio101 14-Nov-2000 • Protein interactions with proteins • SNPs to morphology & pathology • Quantitation of metabolites • Concentrations & fluxes • Protein interactions with small molecules • Binding & catalysis • Basic types of models • Effects on morphology & physiology