Download
1 / 10
100 likes | 198 Vues
Mill Frequency and Sediment Load in Bennington, Caledonia, and Chittenden Counties, Vermont. Andrew Boule and Miles Sturm December 10, 2003. How A Mill Works - The Wheel House. Introduction. - counties chosen for varying geography. -painting of mills, dams, and ponds. Methods.

E N D
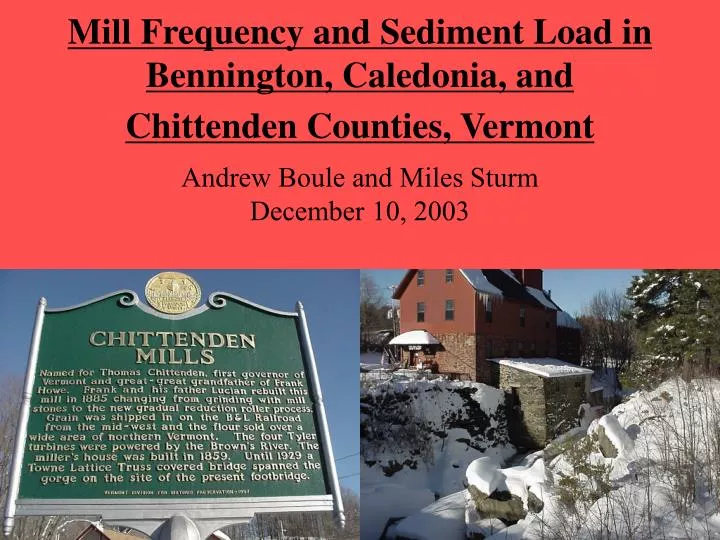
Mill Frequency and Sediment Load in Bennington, Caledonia, and Chittenden Counties, Vermont Andrew Boule and Miles Sturm December 10, 2003
Introduction - counties chosen for varying geography -painting of mills, dams, and ponds
Methods • Looked for mills on Walling’s maps, 1856 - 1858 • Calculated mill frequency for each town (per square mile) • Looked for relationship between mill frequency and population and relief • In the field, we looked for sediment deposits behind former mill sites and other evidence of landscape change
Sample Town – Woodford, 1856 Population: 423 Mills: 20 saw mills (orange) 4 ocher mills and 1 oil mill (pink) Area: 123.28 sq. km Mill Frequency: .2028 mills/sq. km (highest of towns sampled)
Results -predominantly saw mills -mill frequency Bennington 0.03 /sq km Caledonia 0.03 /sq km Chittenden 0.02 /sq km
Results Burlington Woodford -slight inverse relationship
Affect On Stream Path Upon Removal Of Dams 1857 Jericho 1996
Conclusions • Higher mill frequency was found in mountains with higher average slope and less population density. • Sediment trapped behind dam was likely transported downstream after the destruction of the dam. • Change in Browns River displays the impact humans have on landscape change as far as the construction and destruction of dams
Old Red Mill, Jericho Circa 1895 Yesterday