Download
1 / 19
190 likes | 336 Vues
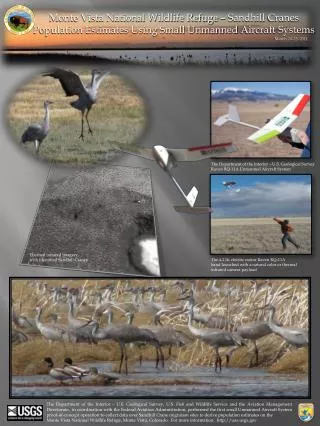
From a Study Design Assessment for Waterfowl Production Surveys on Tetlin NWR by Jonathan Greenberg (intern) and Joel Reynolds (former Regional Biometrician). The Science Behind the Survey:

E N D
From a Study Design Assessment for Waterfowl Production Surveys on Tetlin NWR by Jonathan Greenberg (intern) and Joel Reynolds (former Regional Biometrician) The Science Behind the Survey: A very short introduction to some behind the scenes design (re-)considerations of a typical Refuge study. Peter Keller Wildlife Biologist Tetlin National Wildlife Refuge Tok, AK Friends of Alaska National Wildlife Refuges, 19 October 2010
Where is the Refuge? http://alaska.fws.gov/nwr/images/map.jpg
Background • Survey designed in the 1980’s using maps from the 1950’s • Potential for improvements in design and analysis?
Survey Protocol • Survey 11 clusters of lakes each year • fly out and walk around • Identify all waterfowl and broods • Age-class all broods • 1 – downy ball of fluff (~1-18d) • 2 – feathers come in (~19-43d) • 3 – fully feathered chick, flightless (~44-50) • Takes 22 person-days per year to complete
Project Goals • Assess Tetlin NWR’s waterfowl brood production survey (initiated 1980’s) • Use historic data to suggest design improvements
Why Survey? • Provide short-term production data for hunting regulations • Enhance understanding of waterfowl population dynamics • Provide a “red flag” for the effects of climate change on waterfowl environment
Protocol Assessment: Management Objectives Current Objective: • Detect major population changes on the order of 25% with 95% certainty Issues: • Objectives are not detailed enough Recommendations: • Clearly define species and time-scales of interest, type of change of interest (yr. to yr., trend), and acceptable precision rates • Example:Detecting an average annual decline of 5% over a 5-year period in Wigeon density on Tetlin NWR with significance level of 10% and 80% power
Protocol Assessment: Species of Interest Current: • 12 species are currently being studied Issues: • Not all species are abundance enough to support analysis Recommendations: • Limitanalysis to AGWT, AMWI, MALL, BUFF, RNDU, SCAU (that was easy!)
Sample unit – the level at which we sample Recommendations: Define constraints: logistical (can we get there? can we survey it in one day?) and waterbody size (e.g. between 0.5 and 5 acres) • Sample frame – portion of the target universe that we’re actually able to study to make inference about the target universe • Recommendations: Identify and label all clusters of waterbodies in the sample frame using GIS • (only 700,000 acres to choose from!) How to choose what/where to study? Definitions: • Target universe– all items we wish to learn about Recommendation: Define the target universe as all waterbodies within Tetlin NWR
Measurement: Responses of Interest Current: • Species, brood age class, and number of young for each detected brood in each waterbody Issues: • Not all broods are detected • Number of young is problematic due to within season mortality • Mortality is related to survey timing Recommendations: • Analysis 1: Use broods (instead of young) as the response variable • Analysis 2: Develop a mortality model to project # fledged from # young per age class • Design 1: Time surveys so the brood age class distribution is consistent across years for a species • Design 2: Develop 2 surveys (1 for dabblers, 1 for divers)
Measurement Issues: Mortality Current: • The potential effects of mortality are not accounted for in the current analysis or survey design • Young (regardless of age class) are counted equally
Measurement Issues: Accounting for Survey Timing/Mortality Issues Recommendations (Cont.): Analysis 2:Develop a model of within-season mortality to project the number of young observed to the number of fledged young expected
Measurement Issues: Mortality Modeling Recommendations: • Conduct a study on waterfowl mortality in Tetlin NWR • Develop a more refined mortality model, fit it to the historic data, and validate it with local studies on waterfowl mortality
Measurement Issues: Accounting for Survey Timing/Mortality Issues Recommendations (Cont.) • Design 2: Develop 2 surveys (1 for dabblers, 1 for divers)
Assessment: Covariates (cont.) Recommendations (Cont.): • What other factors are known/expected to influence brood production? Are any of them available from other sources or ‘easily’ measured? • Cluster-scale factors • hunting/gathering; fires; river influences, etc. • Refuge-scale factors • precipitation; temperature, etc. • Migratory factors (that are available) • flyway weather patterns; food resources, etc.
Survey Recommendations • Clearly define management objectives • List all clusters in the Tetlin NWR • Determine the accessibility of all clusters, establish size and logistical constraints, and clearly define the sample frame • Calculate the percentage of inaccessible clusters to assess the magnitude of potential bias • Develop a protocol for re-measuring waterbodies and water acreage in the target universe every 10-20 years • Brainstorm possible biologically related covariates for brood production • Examine the relationship between water level and brood production
Survey Recommendations • Observe a random sample of clusters in addition to the 11 clusters currently selected in order to develop a calibration between the current sample and the target universe (apply this calibration to the historical data) • Approximate brood/young mortality in Tetlin and develop a model to account for it (a graduate project for sure!) • Celebrate!
Survey Suggestions • The target universe should be defined as all clusters of waterbodies in Tetlin NWR • The sample frame should be defined as all accessible clusters of waterbodies in Tetlin NWR • Waterfowl production calculations should use number of broods (instead of number of young) because broods are less sensitive to mortality (but then we don’t get any estimate of young produced) • Canvasbacks, Blue-winged Teals, Northern Pintails, and Northern Shovelers do not occur with sufficient frequency or abundance to support summarization or analysis (although we should still document their occurrence in case this changes, as all things do)
The End! Thank you for this opportunity!