Download
1 / 18
180 likes | 188 Vues
Spreadsheet Charts: From Digits to Drawings. Spreadsheet Software Chart types Good and Bad Ethics. Spreadsheet Software. Allows the user to take control of numbers, manipulating them in ways that would be difficult or impossible otherwise

E N D
Spreadsheet Charts:From Digits to Drawings • Spreadsheet Software • Chart types • Good and Bad • Ethics
Spreadsheet Software • Allows the user to take control of numbers, manipulating them in ways that would be difficult or impossible otherwise • Charts - were once very difficult, now part of the software • can turn the worksheet numbers into charts automatically
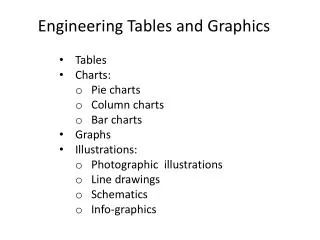
Creating Charts from Numbers • Offer a variety of basic chart types and options for embellishing charts • differences among chart types are more that aesthetic • each chart type is well suited for communicating particular types of information
Pie Chart • Relative proportions of the parts to a whole
Line Chart • Show trends or relationships over time • show relative distribution of one variable through another (the classic bell-shaped normal curve)
Bar Charts • Appropriate when data falls into a few categories. • Bars can be stacked in a stack chart that shows how proportions of a whole change over time.
Scatter Charts • Used to discover, rather that display a relationship between two variables
What about graphs and charts? • 1992 Presidential election - ( Ross Perot used many graphs) • One picture is worth a thousand words • Candidates spoke about trend lines, investments and deficits and did so using colorful charts and graphs. • voodoo economics
What about graphs and charts? • It is simple to create a line graph that drives home the increase in the national debt, • a bar graph that compares market share for U.S. and foreign automobile manufacturers. • When you design a graph you have a responsibility to your audience
Making Smart Charts • Powerful communication tool • not designed intelligently... can mislead or confuse
Guidelines • Choose the right chart for the job. • Keep it simple, familiar and understandable • Strive to reveal the truth, not hide it.
Spreadsheet Ethics: Making Numbers Lie • Figures do not lie • …but, you must be careful about the figures you see, for they are only as accurate as the person who entered them.