Download
1 / 20
240 likes | 390 Vues
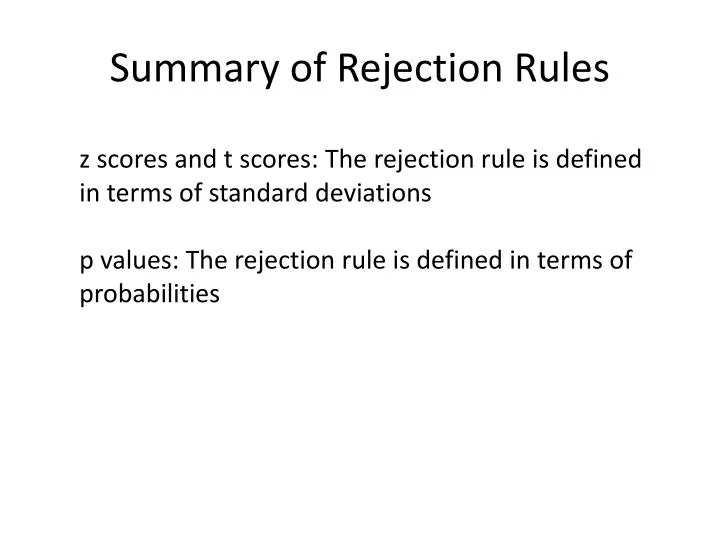
Summary of Rejection Rules. z scores and t scores: The rejection rule is defined in terms of standard deviations p values: The rejection rule is defined in terms of probabilities. Summary of Hypothesis Tests About a Population Mean. * Where p is calculated using one tail

E N D
Summary of Rejection Rules z scores and t scores: The rejection rule is defined in terms of standard deviations p values: The rejection rule is defined in terms of probabilities
Summary of Hypothesis Tests About a Population Mean * Where p is calculated using one tail ** Where p is calculated using both tails
Hypothesis Test Exercise A chicken farmer is using a different chicken feed. In the past the average weight of a chicken was 2 lbs. The farmer wants to test to see if the weight of the chickens changed at a .02 significance level. A sample of 31 chickens was drawn and it was found the average weight was 2.1 lbs. with a sample standard deviation of 0.5. Conduct the hypothesis test for the farmer.
Hypothesis Test with s Unknown H0: m = 2 Ha: m ≠ 2 Reject H0 if t < -2.457 or t > 2.457 Accept H0. The evidence is not strong enough to reject H0, we would assume the average weight of the chickens has not changed.
Hypothesis Test Exercise A contactor is wants to test whether bags that claim to contain 50 lbs of cement actually weigh less than 50 lbs. He decides to conduct the test at a .025 significance level. He selects a sample of 101 bags and finds the average weight is 49.5 lbs, with a standard deviation of 1 lbs. Conduct the hypothesis test for the contractor.
Hypothesis Test with s Unknown H0: m> 50 Ha: m < 50 Reject H0 if t < -1.984 Reject H0. The evidence suggests that the weight of the bags is less then 50 lbs.
Hypothesis Test of Proportions One-tailed test to the left H0: p > p0 Ha: p < p0 One-tailed test to the right H0: p < p0 Ha: p > p0 Two-tailed test H0: p = p0 Ha: p ≠ p0
Hypothesis Test of a Proportion A firm has introduced a new benefits package and it wants to see if employee turnover has fallen. In the past the percentage of employees that quit before the end of the year was 10%. A sample of 200 employees was drawn, of those 10 had left the firm over the past year. Conduct a hypothesis test with a significance level of .01%.
Hypothesis Test of a Proportion H0: p > .10 Ha: p < .10 Reject H0 if z < -2.326 Reject H0. The evidence suggests the benefits package reduced turnover.
Hypothesis Test of a Proportion A pollster wants to find if support for health care reform has changed after a recent series of advertisements. Previously, 60 percent supported health care reform and 40 percent were opposed. A new poll of 100 voters showed support had dropped to 55 percent. Conduct a hypothesis test at a significance level of 5%.
Hypothesis Test of a Proportion H0: p = .60 Ha: p ≠ .60 Reject H0 if z < -1.96 or z > 1.96 Accept H0. The evidence is not strong enough to conclude that support for health care reform has changed.
Graded Homework P. 363, #33 P. 370, #45 P. 382-383, #63, 73
Difference of Two Means Frequently we want to compare whether two groups have different characteristics, we want to know if the population mean for one group is the same as the mean for a different group. (see pages 396-399)
Differences of Means One-tailed test to the left H0: m1-m2> D0 Ha: m1-m2 < D0 One-tailed test to the right H0: m1-m2< D0 Ha: m1-m2 > D0 Two-tailed test H0: m1-m2 = D0 Ha: m1-m2 ≠ D0
Difference of Means A researcher wants to find out if the number of miles men and women drive to work is different. A sample of 100 men is collected, the average distance for the men was 10 miles. Likewise, a sample of 100 women was drawn, and the average distance was 12 miles. Assume the population variance was 40 for men and 60 for women. Conduct the test with a = .05 and women as group 1.
Hypothesis Test, Difference of Means H0: m1-m2 = 0 Ha: m1-m2 ≠ 0 Reject H0 if z < -1.96 or z > 1.96 Reject H0. The evidence suggests that there is a difference between the number of miles men and women drive to work.
Difference of Means A researcher wants to find out if the starting salaries for economics majors is higher than the starting salaries for management majors. Samples of 400 were drawn for both groups. The average starting salary for economics majors was $30,100 and $30,000 for management majors. The population variance was $6,000 for economics majors and $4,000 for management majors. Conduct the test with a = .05 and economics majors as group 1.
Hypothesis Test, Difference of Means H0: m1-m2< 0 Ha: m1-m2 > 0 Reject H0 if z > 1.645 Reject H0. The evidence suggests that economics majors earn more.