Download
1 / 10
100 likes | 174 Vues
White Noise Correlation and B-mode glitching. From Kieran’s SPIE proceedings. Recall the definition of Double Demodulation: DDmod(D i ) = [Dmod(D i , PSA = +1) - Dmod(D i , PSA = -1)]/2 D i = Q 1 , Q 2 , U 1 , U 2

E N D
Recall the definition of Double Demodulation: DDmod(Di) = [Dmod(Di, PSA = +1) - Dmod(Di, PSA = -1)]/2 Di = Q1, Q2, U1, U2 Since βA and βB are not identical to unity, expect certain correlations: DDmod(Q1) = A I βB (βB-1) + B Q DDmod(Q2) = - A I βB (βB-1) + B Q A and B are constants that depend on betas and gains. The average DDmod is does not have any dependence on I DDmod(Q1) + DDmod(Q2) ~ Q I-to-Q leakage
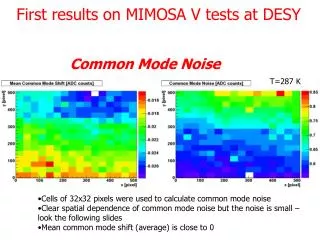
B-mode glitching RQ_0000 behavior versus time for CES #3 Run ID# 3010
B-mode glitching I have NOT YET implemented the correction package for this effect. This effect is IMPORTANT. It affects the 1/f noise measurement. The ADC misbehaves at certain total power levels. Correction is slightly complicated since underlying problem happens at 800 kHz, and we have access to only 100 kHz data.
Before B-glitch correction After B-glitch correction
RQ_0000 FFT for CES #3 Run ID# 3010 mV2/Hz versus freq(Hz)
Definition of White Noise Correlation F are the frequency components from the FFT F-bar denote complex conjugate of F i,j are diode indices (Q1, Q2, U1, U2) < > refer to average over all frequencies > 10 Hz
Noise Correlation versus Frequency RQ_0000 for CES #3 Run ID# 3010