Download
1 / 19
190 likes | 327 Vues
Science: observation, measurement, models. Class outline: whole semester. I. Introduction: Astronomy and Science II. Motions in the Sky: Astronomy By Eye III. Overview of the Universe IV. The Physical Basis of Astronomy: Gravity and Light V. Some interesting astronomy questions.

E N D
Class outline: whole semester I. Introduction: Astronomy and Science II. Motions in the Sky: Astronomy By Eye III. Overview of the Universe IV. The Physical Basis of Astronomy: Gravity and Light V. Some interesting astronomy questions
What is science? • Science is a process by which we learn about the world • Science is not a collection of facts • Can be driven by curiosity or a need to know • Science relies on observations, i.e. measurements, also known as DATA • If an idea can’t be backed up with supporting data, and potentially refutable, it is not a scientific idea • Measurements almost always have some uncertainty associated with them • Understanding the quality of a measurement is often critical to being able to interpret it • Scientific progress often is related to breakthroughs in ability to collect data, or to reductions in the uncertainties associated with the data
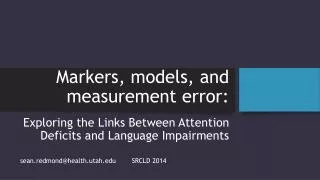
Measurement accuracy/error • Very difficult, if not impossible, to interpret data without understanding how accurate it is! Uncertainties can come from • Tools used for measurement • Variation in thing being measured • Variation between different objects • (example: mean weight of a population) • Sometimes uncertainties are small compared with things being measured, sometimes not! • You can’t really interpret data without understanding the measurement uncertainties • Good skill: when someone presents you with data, understand or ask about the uncertainties. Without uncertainties, presentation of data is incomplete • Sometimes scientists use the word “errors” as a synonym for “uncertainties”. Don’t be misled.
Example: Am I gaining weight? A Yes B No C Information is incomplete
Example: Am I gaining weight? A Yes B No C Can’t tell from these measurements: need more, or better, data D Information is incomplete Conventionally, error bars represent the range where the true measurement is likely to fall 2/3rds of the time; 95% of the time, the true measurement should be within double the length of the error bars.
How to improve? More data: fill in the time sequence Repeat measurements: use different scales
How to make things better? Try to reduce measurement error: use a better scale, average together more measurements When looking for a trend, try to extend the baseline: look over a longer period of time
Even better data: six scales over more time • NOTE: • These are simulated data where the input was a constant weight gain per year • Even so, data that has some measurement error show some years with no apparent gain • Statistics, with well defined errors, can say how probable an interpretation of the data is A Yes B No C Can’t tell from these measurements D Information is incomplete
Measurement uncertainties • Just because there are measurement uncertainties doesn’t mean you can’t believe measurements: if trends are larger than errors, they are believable! • Ironically, if someone doesn’t give you uncertainties, it perhaps makes results less believable! • Data don’t always come in the form of numbers, but it can be helpful if you can figure out how to represent it with numbers, so you can have quantitative error estimates
Sum up: observations/measurements/errors Science is based on observations / measurements. Which of the following is true? A any measurement that can be represented by numbers gives a perfect assessment of what is going on with the object you are observing B all measurements have associated uncertainties, but since you can’t do anything about them, you just interpret the results from the measurements you have without worrying about the uncertainties C you need to understand the size of the expected uncertainties so you can decide whether the interpretation of the measurements is valid D if you have measurements that have uncertainties, you cannot draw any conclusions from the data
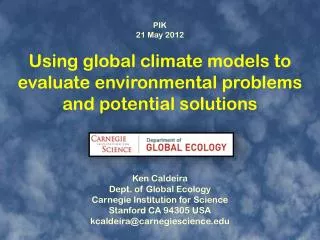
Science: making progress • Improvements in the ability to measure things, or clever new ways to measure things, often leads to advances in understanding
What is the shape of the Earth? A Flat (except for mountains) B Spherical C Cubical D Depends on where you’re looking from The horizon at the ocean How do you know? How is your knowledge consistent with the data shown in the picture? Is there new data that makes the situation clearer?
Shape of the Earth • Shape of the earth was known long before external images, and even before circumnavigation! • Shadows and eclipses • Clever measurement ideas can be powerful! Some people are very good at this, and often concentrate on experiments/observations
Scientific models • Data by itself is only a part of science: science generally tries to put data into a context of understanding what is being measured • Observations/measurements often lead to scientific models, or interpretations/hypotheses • Sometimes, multiple models may be consistent with observed data • New, or better, data, can sometimes resolve the issue
What is moving? Location of Sun over course of a year, at the same time each day Location of Sun over course of a day • Two models: • Sun is moving • Earth is moving • Which is correct? How do we know?
Earth/Sun motion • This one is actually a lot harder! • Not widely accepted that Earth was moving, not Sun, until about 500 years ago • New technology makes issue fairly clear, but again, the correct model was known before this new technology was available
To do • By next class: • Complete online assessment on Canvas: guaranteed 100% for first homework! • Bring $10 to lab for lab manual • We will set up using iClickers in lab. If you have one that you want to try to use, bring it to labs • Continue to master your directions! • Start to look at the sky • Useful resources: see class home page • If you don’t already know, look up how to find the Big Dipper • Go out at night and find it • What direction do you have to look to find it?