Download
1 / 18
180 likes | 186 Vues
Energy for What’s Ahead. Our Transportation Electrification Pathway. Lisa Arellanes Senior Manager, eMobility April 24, 2019. We’re Driving The Agenda :. The Emissions Challenge ICT Support Charge Ready Transport Program SCE is Here to Help.

E N D
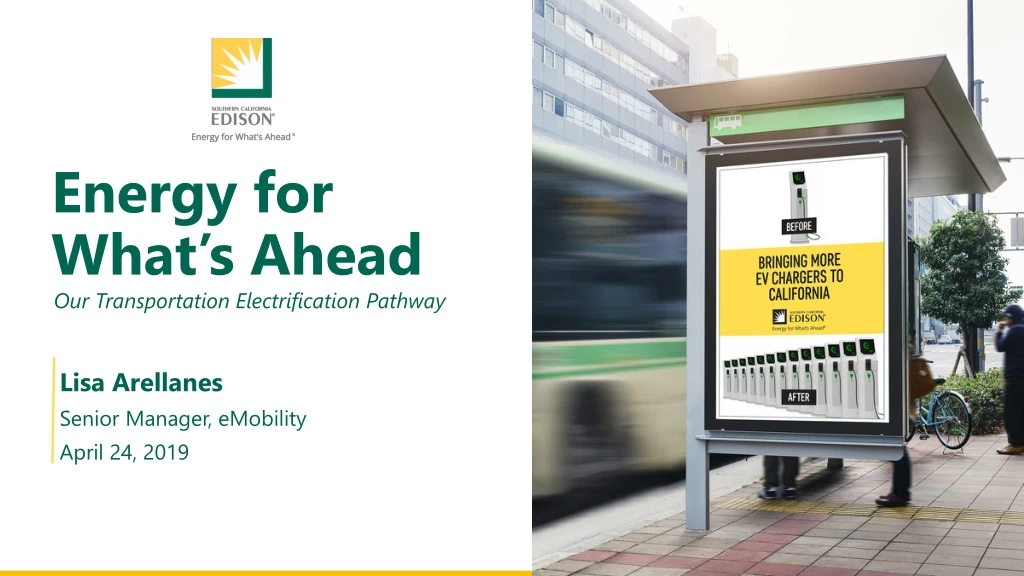
Energy for What’s Ahead Our Transportation Electrification Pathway Lisa Arellanes Senior Manager, eMobility April 24, 2019
We’re Driving The Agenda: • The Emissions Challenge • ICT Support • Charge Ready Transport Program • SCE is Here to Help
California’s GHG Emissions Reductions Goals Agricultural 8% Residential & Commercial 11% 39% 19% Transportation Electric Power 17% Industrial 6% Transportation- Related Industrial If we want to get to zero emissions, eventually we have to replace many of the things we rely on today that require combustion.
Transportation Electrification Pathway to 2030 20x increase Clean Power and Electrification Pathway white paper available at: sce.com/pathwayto2030
Vehicle pollution impacts a concentrated number of communities disproportionately 82% of NOx emissions are caused by mobile sources Note: Communities are considered DACs if they are in the worst quartile of environmental & economic burden, as evaluated by the California EPA using CES 3.0. Freight corridors.
We asked transit agencies about their top concerns regarding Innovative Clean Transit (ICT) regulation • 20+ agencies responded • Directors of Maintenance • Fleets & Facilities • Executive Directors • Engineers • Project Managers • Analysts • Range of Fleet Sizes • 8 to 2400 • Current Electric Buses in Fleet • 0 to 33
SCE’s is here to support your ZEB Rollout Plans • Estimated schedules for construction of facilities and infrastructure upgrades for bus charging • Information on available funding from our infrastructure programs to support electric buses • Customized estimates of electricity costs and LCFS credits to assist you in comparing fueling costs • Suggestions for a phased-in approach to ZEB procurement and infrastructure deployment to avoid interruptions to your operations
Funding Opportunities Improve ROI from Acquisition to Operation for Fleet Owners Infrastructure Fueling Vehicles + + • $30,000 - $175,000 from HVIP • Up to $60,000 from Carl Moyer • FTA Low/No Program for Transit Buses • Regional incentives • Free infrastructure from grid to chargers through SCE’s Charge Ready Transport Program • HVIP • Other utility incentives • SCE EV Rates – Zero demand charges until 2024 • Low Carbon Fuel Standard Credits (LCFS)
Charge Ready supports different types of electric vehicles Electric Shuttle Buses Non-revenue vehicles TransitBuses • Buses & shuttles • Non-revenue vehicles • Employee & visitor parking
SCE installs “make-ready” electrical infrastructure at no cost Charging Stations Transformer Conduits and Wires Service Meter Panel Utility Distribution Infrastructure Participant Site Infrastructure Charging Stations Program covers costs associated with service drop, meter, panel, and circuit dedicated to EV charging. Make-ready ends at interconnection point with customer charging equipment providing AC service.
Choose from a pre-approved list of chargers and charging speeds to meet your needs • AC Charging • Up to 17 kW • Standard Connector • DC Charging • Up to 150 kW or more • Standard Connector
SCE’s Charge Ready Transport Infrastructure Program Journey Varies 2-3 Months 45 Days 6-9 Months 1 Month Up to 10 Years
New EV Rates level fueling costs with phased-in demand charges • Available now • Zero demand charges until 2024 • Monthly peak demand can be reduced by building or other “general service” demand at the same site • Encouraging off-peak charging: Higher energy rates on-peak (4-9 PM) • EV rates available for separately-metered charging installation
Additional Programs and Services Transportation Electrification Advisory Services • Fleet Analysis Services • Rate Intro and Rate Analyses • LCFS Credit Estimation • GHG Calculations Transportation Electrification Project Management • Support customer-led projects outside of programs • Single Point of Contact for multi-site projects Self Generation Services • Review plans for solar and battery storage projects • Conduct analysis of feasibility and customer savings • Provide a third-party check on vendor claims
Over 6 million internal combustion engine cars are sold in the US each year. Successfully decarbonizing the transportation sector will require all of us working together.
Join us on this ride. Lisa Arellanes Senior Manager, eMobility Southern California Edison