Download
1 / 42
510 likes | 790 Vues
Chapter 6 Poverty, Malnutrition and Income Inequality. Poverty, Malnutrition & Income Inequality. How can we provide a good quality of life & productive work for the 700-1000 million (10-15%) of world’s 6.5 billion people who are poor or living on no more than $1 a day?

E N D
Chapter 6 Poverty, Malnutrition and Income Inequality
Poverty, Malnutrition & Income Inequality • How can we provide a good quality of life & productive work for the 700-1000 million (10-15%) of world’s 6.5 billion people who are poor or living on no more than $1 a day? • Economic growth is the most important factor contributing to poverty reduction (Fig. 6-1). • Country in which you live determines your position in world’s economic class system. • Milanovic (2002): 88% of 1993 world inequality from between-country inequality.
Information sparsity • International Labour Organization – using data for policy is like trying to run through the forest in the dark without a flashlight. • Presently cross-national figures on poverty and inequality but few by region or community within a nation. • Identifying and reaching the poor to enable their geographical targeting requires detailed poverty mapping, with data on poverty assessment and “basic needs” indicators at local levels (San Martin 2003). • Few national surveys are adequate for “guid[ing] poverty alleviation efforts aimed at attacking poverty at local levels” (ibid., 2003, p. 173).
Fields on minimal data standards (1) the database actual household survey or census; (2) encompass all income, including nonwage income; (3) include local price information, including rural-urban cost-of-living differences; (4) national in coverage; (5) disaggregated at the canton, district, or county level; (6) avoid lags between collection and publication, and long gaps between survey rounds; and (7) to compare across time, surveys, measures, and the income concept and recipient unit must be constant.
Also • For time-series consumption or income, household data and poverty lines need to be adjusted for inflation, frequently with high inflation rates. • Should have information on non-cash income such as food and other goods produced at home. • Yet a few careful studies.
Topics to be discussed • Multifaceted nature of poverty. • Global income inequality. • $1/day and $2/day poverty. • Global and regional poverty. • Effect of poverty on access to education and health. • Poverty since the 19th century. • Sen’s 3 measures of poverty and deprivation. • Sen’s capabilities approach to poverty.
Topics to be discussed (cont) • Lorenz curve & Gini index for income distribution. • Poverty – World Bank, Bhalla, & Sala-i-Martin. • Kuznets’s inverted-U explanation for changes in income distribution with growth. • Adelman and Morris’s dual-economy stage theory of the inverted-U curve. • Differences in poverty and inequality by: • low-, middle-, and high-income countries; • DCs and LDCs; • slow- and fast-growing countries; and • gender.
Topics to be discussed (cont) • Accompaniments of absolute poverty. • Subgroups hurt by poverty. • Case studies of LDC policies. • Policies to reduce poverty & improve income distribution. • Relationship between inequality and political instability.
Poverty as multidimensional • Poverty consists of interlocked dimensions, yet lack of food dominant. • Poverty has important psychological dimensions, such as powerlessness, voicelessness, dependency, shame, and humiliation. • Poor people lack access to basic infrastructure – roads, transportation, & clean water. • Education offers escape if economic environment favorable & quality of education is good. • Poor health & illness source of destitution. • Assets – physical, human, social, and environmental – crucial. Has gender dimension(Narayan et al. 2000:4-5).
$1/day & $2/day poverty • Absolute poverty – below income securing bare essentials of food, clothing, & shelter. • Inter-country comparisons difficult although assumed can compare $PPP. • World Bank - $PPP1/day & $PPP2/day in 1985, same as $PPP532 & $PPP1064 yearly in 1998. • Page 172 indicates diet comparable to poverty line: 2 cups of hot prepared rice, equivalent to 54% of total diet (based on typical gender & age distribution).
Table 6-1 Table 6-3 & Figure 6-5 show poverty rates over time and by region.
Sen’s Concepts & Measures of Poverty • Emphasizes capabilities not attainments. • G, H & I. • H: Headcount approach (poverty %). • I: Income-gap approach – additional income to bring poor up to poverty line. • G: Gini – distribution of income among the poor.
3 measures of poverty:World Bank, Institute of International Economics, & Sala-i-Martin (Tables 6.1- 6.3) • Sala-i-Martin – goes beyond 20-percentile quintiles (fifths) of World Bank data to 1-percentile increments by interpolation & testing. • Includes China but not Former Soviet Union, Former Yugoslavia, & Bulgaria. • Fig. 6-3 (showing falling global income inequality) is consistent with Firebaugh.
3 measures of poverty:World Bank, Institute of International Economics, & Sala-i-Martin (Tables 6.1- 6.3) • World Bank (Milanovic) – Sala-i-Martin uses linear extrapolation for quintile shares. • - where if a nation has only one point, he assumes constant income shares. • - where if a nation has no points, all individuals have income per capita of country. • Are data for individual or household? Not certain. • No Former Soviet Union, Former Yugoslavia, & Bulgaria; China’s data have large margin of error, so inequality could be either falling or increasing.
3 measures of poverty:World Bank, Institute of International Economics, & Sala-i-Martin (Tables 6.1- 6.3) • Bhala (IIE) – World Bank’s consumption based on household surveys that come up with absurd results – average Korean richer than average Swede; Ethiopia is 3 times richer than India. • National income consumption not household survey means should be used. • Bhalla uses national accounts/household survey multiplier. • Agrees with Sala-i-Martin that inequality fell; possible even if many national inequalities increase. • Argues that % increase in consumption of poor/% increase in consumption of non-poor > 1.
Bhalla’s argument: imagine no country • Shift from world’s lower class (less than $PPP10/day at 1993 prices) to world’s middle class ($PPP10-$PPP40/day). • Consumption by the world’s poor, driven largely by China & India, grew more rapidly than consumption by the rich, 1980-2000.
Early & late stages of development – Adelman & Morris • Test Kuznets’ hypothesis on inverted-U relationship between per capita income (X-axis) & inequality (Gini) (Y-axis). • Assumes dual economy, with growing modern sector share.
Is there evidence for the Kuznets’ inverted U? • Yes, for a given time period, as Figure 6-10. • More questionable when you examine long-term data for given countries.
Females are the major victims of poverty • Need resource allocation within households & families (Dasgupta). • Data fail to show gender inequality, a major source of interpersonal inequality. • Income inequality would be 30-40% higher if inter-family gender inequality calculated (e.g., 0.57 for South Africa X 1.35 = 0.77; 0.29 Bangladesh X 1.35=0.39).
Sen on “missing women”: low female to male ratio • West 105 to 100; sub-Saharan Africa 102; 98 North Africa; 94 China, Bangladesh, & Middle East; 93 India (Kerala 104). • With sub-Saharan Africa as benchmark, Sen estimates 44 million missing females in China & 37 million in India. • Why? Family directs resources to males.
Accompaniments of absolute poverty for 400-1100 million $1/day • 3/5- 4/5 spent on food. • 50% undernourished. • 2/10 die by 10 years. • Immunization rates low. • Lack access to safe & plentiful water & sanitation. • Average life expectancy 45 years.
Accompaniments of absolute poverty for 400-1100 million $1/day • 1/3 - 2/5 adults literate. • 4/10 complete > 4 years primary school. • In environmentally marginal & vulnerable areas, higher rates of unemployment, higher fertility rates.
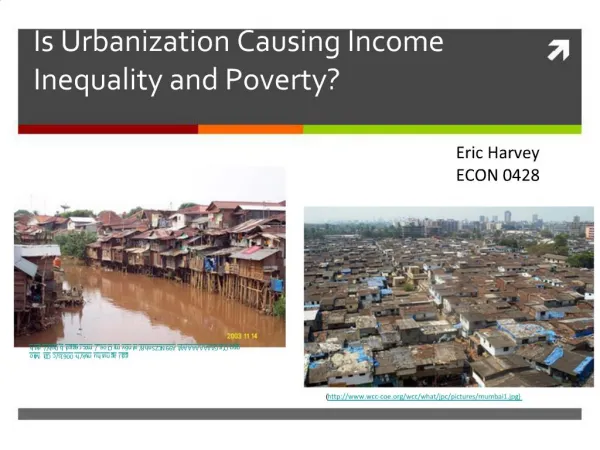
Poverty groups • 4/7 in sub-Saharan Africa; 1/6 East Asia; 1/6 South Asia. • Indigenous & minority groups overrepresented. • 4/5 live in rural areas; many urban slums. • Rural poor landless workers, sharecroppers, tenants, & small landowners. • Urban poor unemployed, irregularly employed, menial workers, some small business people.
Poverty groups (cont) • Relatively few wage laborers, unemployed compared to DCs. • Most illiterate. • Women, especially heads of households. • 40% children under 10. • Elderly poorer. • Many live in remote regions, beyond gaze of casual visitor to village – away from roads, markets, & services.
Income equality vs. growth Controversy (pp. 210-212)
Poverty, inequality, & war • Wars & massive state violence occur mostly in low income countries, some of which are failed states. • Economic stagnation worsens relative deprivation. • Failed states associated with widespread rent seeking. • Some predatory states, where elites plunder the economy.
Policies to reduce poverty & inequality • Combined discussion of policy issues in Chapter 6, pp. 202-210 and Chapter 7, pp. 245-264 (see Ch. 7 powerpoint).