Download
1 / 30
300 likes | 415 Vues
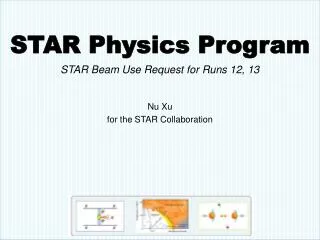
Quarkonia Measurements in STAR. Thomas Ullrich on behalf of Zhangbu Xu (for the STAR Collaboration) Brookhaven National Laboratory. Outline: Introduction J/ y results results Outlook. Quarkonia in sQGP. How does quarkonium behave in the presence of sQGP ?.

E N D
Quarkonia Measurements in STAR Thomas Ullrich on behalf of ZhangbuXu (for the STAR Collaboration) Brookhaven National Laboratory • Outline: • Introduction • J/y results • results • Outlook
Quarkonia in sQGP How does quarkonium behave in the presence of sQGP? • Color screening1) • Recombination 2) • Heavy quark (radiative & collisional) energy loss 3) • Decay feed-down • Comover & cold matter effects in hadronic phase & initial stage 1) T. Matsui and H. Satz, Phys. Lett. B178, 416 (1986) 2) R. L. Thews and M. L. Mangano, Phys. Rev. C73, 014904 (2006) 3) M. B. Johnson et al., Phys. Rev. Lett. 86, 4483 (2001) and R. Baier et al., Ann. Rev. Nucl. Part. Sci. 50, 37 (2000)
H. Satz, Nucl. Phys. A (783):249-260(2007) J/y High pT J/y in heavy ion collisions Hot wind dissociation J/y suppression at low pT could be from suppressed excited states (y’, cc) F. Karsch, D. Kharzeev and H. Satz, PLB 637, 75 (2006) High pT direct J/y suppression related to hot wind dissociation? H. Liu, K. Rajagopal and U.A. Wiedemann PRL 98, 182301(2007) and hep-ph/0607062 2-component approach Predicted decrease RAA X. Zhao and R. Rapp, hep-ph/07122407 Color singlet model predicted an increase RAA(formed outside of medium) K. Farsch and R. Petronzio, PLB 193(1987), 105 J.P. Blaizot and J.Y. Ollitrault, PLB 199(1987),499 T. Gunji, QM08
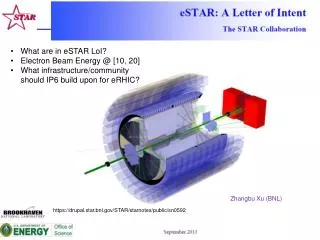
The STAR Detector Large acceptance: 2 coverage at mid-rapidity Magnet Coils Central Trigger Barrel (CTB) ZCal Time Projection Chamber (TPC) Year 2000 Barrel EM Cal (BEMC) Silicon Vertex Tracker (SVT)Silicon Strip Detector (SSD) FTPCEndcap EM CalFPD TOFp, TOFr PMD Year 2001+ Future upgrade: Time of Flight, DAQ1000, Heavy Flavor Tracker, Muon Telescope Detector RBRC Workshop, BNL, April 23-25, 2008
Low pT J/y in p+p at 200 GeV MC describes position and width J/ytrigger: 2 × Ee > 1.2 GeV ⇒ J/y: 0 < pT < 5.5 GeV/c p+p 200 GeV STAR has J/y capabilities at low pT Mass and width consistent with MC simulations, low mass tail from electron bremsstrahlung Integrated p+p luminosity at 200 GeV: 0.4 pb-1
EMC+TPC electrons: |h|<1, pT>4.0 GeV/c TPC only electrons: |h|<1, pT>1.2 GeV/c High pT J/y in p+p at 200 GeV EMC trigger J/y pT p+p 2005 EMC+TPC electrons: |h|<1, pT>2.5 GeV/c TPC only electrons: |h|<1, pT>1.2 GeV/c (S+B)/B: 24/2 3 pb-1 No background at pT>5GeV/c J/y pT p+p 2006 (S+B)/B: 54/14 11 pb-1 Reach higher pT (~14GeV/c)
J/y spectra in p+p at 200 GeV • Significantly extend pT range of previous measurements in p+p at RHIC to 14 GeV/c • Agreement of charm measurements between STAR and PHENIX • Consistent with Color Evaporation calculations (R. Vogt, Private communication)
J/ψ in Cu+Cu • Signal with good S/B ratio • pT range overlaps with p+p data • Luminosity: 0.9 nb-1
Nuclear modification factor RAA • Double the pT range to 10GeV/c • Consistent with no suppression at high pT: • RAA(pT>5 GeV/c) = 0.9±0.2 2s above low-pT data • Indicates RAA increase from low pT to high pT • Doesn’t agree with AdS/CFT prediction • Formed outside of medium? • Not affected by heavy quark/gluon energy loss? • Decay from other particles? 2-component Approach predicted slightly increase RAA after more consideration X. Zhao, WWND2008
SPS: In+In, , consistent with no suppression at pT > 1.8 GeV RAA Comparison to NA60 R. Arnaldi (NA60) QM08 RHIC: Cu+Cu, consistent with no suppression at pT > 5 GeV Cronin pApp Thermal fit Important to understand production mechanism
NRQCD Quarkonium production mechanism • Color singlet model (CSM) 1)pQCD • Color octet model (COM) 2) NRQCD • Color evaporation model (CEM) 3) • … • Gluon fusion • Heavy quark fragmentation 4) • Gluon fragmentation 5) • Decay feed-down • … What’s the production mechanism at RHIC energy? 1) R. Baier et al., PLB 102, 364 (1981) 2) M. Kramer, Progress in Particle and Nuclear Physics 47, 141 (2001) 3) H. Fritzsch, PLB 67, 217 (1977) 4) Cong-Feng Qiao, hep-ph/0202227 5) K. Hagiwara et al., hep-ph/0705.0803
ds/dpT [nb/(GeV/c)] Color singlet LHC 14 TeV Tevatron 1.96 TeV LO NLO pT (GeV/c) CSM with kt-factorization PHENIX, PRL 92, 05180 (2004) CSM can also describe the data with some improvement like the kt-factorization approach S.P. Baranov and A. Szczurek arXiv:0710.1792 PRL98, 252002(2007)
xT scaling n is related to the number of point-like constituents taking an active role in the interaction n=8: diquark scattering n=4: QED-like scattering xT scaling: • p and proton: n=6.5±0.8 PLB 637, 161(2006) • J/y: n=5.6±0.2 • J/y production: closer to 22 scattering
(B J/y)/(inclusive J/y) • Generated B spectrum is from pQCD (highest possible values) • M. Cacciari, P. Nason and R. Vogt • PRL 95(2005),122001 • 2) Decay BJ/y, kinematics and branch ratio are from CLEO measurements • CLEO collaboration • PRL 89(2002),282001 • BJ/y might contributes significantly to the inclusive J/y yields at high pT (>5 GeV/c) • No experimental B spectra at RHIC yet • Can be used to constrain B production
(e+e-J/y +cc)/(e+e- J/y + X) = 0.59+0.15-0.13 ±0.12 More J/y production puzzles e+e-, 10.6 GeV B.L. Loffe and D.E. Kharzeev PRD 69, 014016 (2004) Belle, PRL 89, 142001(2002) 0.82 ±0.15 ± 0.14 from new analysis. T. Uglov, EPS 2003 While CEM predict 0.049 D. Kang, et al., PRD 71, 094019 and hep-ph/0412381 NRQCD predict ~0.1 K. Liu and Z. He, PRD 68, 031501 (2003) What happens?: In p+p collisions; At higher energy (200 GeV)
(S+B)/B: 54/14 5.4s J/y-hadron correlation Near side correlation Heavy quark fragmentation Good S/B ratio makes this measurement possible RBRC Workshop, BNL, April 23-25, 2008
1) no near side correlation 2) strong near side correlation PLB 200, 380(1988) and PLB 256,112(1991) Disentangle contributions via Correlations • J/y-hadron correlation can also shed light on different source contribution to J/y production • May be used to distinct CSM and COM ?
J/y-hadron correlation in p+p • No significant near side J/y-hadron azimuthal angle correlation • Constrain B meson’s contribution to J/y yield • Hints of CSM? h-h correlation PRL 95,152301(2005)
Yields in near/away side - • Associated hadron spectra with leading J/y: • Away side: Consistent with leading charged • hadron correlation measurement (h-h)⇒ away-side from gluon or light quark fragmentation • Near side: Consistent with no associated hadron productionB→J/y not a dominant contributor to inclusive J/y • constrain J/y production mechanism
Constrain Bottom yields • pQCD predicts significant B→J/ • Correlations shows low B contribution • Can be used to further constrain B yields • PYTHIA productions all show strong near-side correlation ⇒ higher order production mechanism?
ΥSignal in p+p and Au+Au preliminary • Υ(1S+2S+3S) total yield: integrated from 7 to 11 GeV from background-subtracted mee distribution • Significance of signal is 3σ • Note: Contribution from Drell-Yan (~9%) ignored here • 4 signal • First measurement of in nucleus-nucleus collisions ever • RAA in progress
ϒcross-section in p+p preliminary Bee×(dσ/dy)y=0=91±28(stat.)±22(syst.) pb STAR 2006 √s=200 GeV p+p ++→e+e- cross section consistent with pQCD and world data
dE/dx after TOF cut pT (e)>1.5 GeV/c Future dramatic improvement of J/ψat low pT EMC+TOF (large acceptance): • J/ production • Different states predicted to melt at different T in color medium • Charmonia(J/ψ), bottonia () Quarkonium dissociation temperatures – Digal, Karsch, Satz PHENIX Acceptance: |h|<0.35, f=2*p/2 STAR TOF-Upgrade Acceptance: |h|<0.9, f=2*p J/y yields from 109 minbias Au+Au events: 43.8x10⁻⁹/0.040x109*292*0.5*1.8*0.5= 144,0000.3% v2 error sJ/y spp N Nbine y RAA
High luminosity forϒ& high-pT J/ψ RHIC II + DAQ1000: Time-Of-Flight: Enhance statistics Electron identification
+- Longer term: Quarkonia in STAR Heavy Flavor Tracker: ge+e-rejection Topologically reconstruct J/y from B decay Rejection power: ~16 Muon Telescope Detector: Muon identification simulation
Summary (J/y) • J/y spectra in 200 GeV p+p collisions at STAR • Extend the pTrange up to ~14 GeV/c • Spectra can be described by CEM and CSM. • High pTJ/y follows xT scaling with n=5.6 • Spectra at high pT can be used to constrain B production • J/y-hadron azimuthal correlation in p+p • No significant near side correlationExpect strong near-side correlation from BJ/y+XProvides constrains on J/y production mechanism • Away-side spectra consistent with h-h correlationIndicates gluon or light quark fragmentation • J/yRAA from 200 GeV Cu+Cu collisions at STAR • Extend RAA from pT = 5 GeV/c to 10 GeV/c • Indication of RAA increasing at high pT Near Future: J/y results from Run 7 Au+Au, ϒ RAA, Run 8 d+Au CNM effects, Future runs: with TOF (improved e PID at low pT and 1kHZ STAR DAQ)
Error on averaged RAA at high-pT • all of the 6 data points: 0.93±0.19 • remove 0-20% data points, only MB data points: 0.91± 0.21 • PHENIX also fit all of the central data points in Mike's talk at the RHIC&AGS heavy flavor workshop: 1.08±0.5 The correlation of the central and MB has small contribution because the central data contribution is small itself. • for the three MB data points, the first two data points share the same pp error (slightly different pt bin between STAR and PHENIX, so the pp reference for PHENIX Cu+Cu is from levy function extrapolation, the pp reference for STAR and PHENIX is not directly correlated). • only STAR data points 0.97±0.33 • PHENIX MB and the second one of STAR MB: 0.96±0.24
mean pT2 and cross section STAR Preliminary STAR Preliminary STAR Measurement & world data <pT2>= 2.4+1.2ln(√s) <pT2>=3.43±0.68 (GeV/c)2 CEM calculation M. Bejidian et al., hep-ph/0311048 CEM can also describe the total cross section
Datasets Triggered data High-pT J/y p+p data sample: • 1. J/ψ triggered events in year 2006 • Integrated luminosity: 377 (nb)-1 • 2. Υ triggered events in year 2006 • Integrated luminosity: 9(pb)-1 Au+Au data sample: • 1. Υ triggered events in year 2007 Integrated luminosity: 300(μb)-1 pp-equivalent: 12(pb)-1 p+p data sample: • 1. EMC triggered events in year 2005 ET>3.5 GeV Integrated luminosity: 3 (pb)-1 • 2. EMC triggered events in year 2006 ET>5.4 GeV Integrated luminosity: 11 (pb)-1 Cu+Cu data sample: • 1. EMC triggered events in year 2005 ET>3.75 GeV Integrated luminosity: 0.9 (nb)-1 pp-equivalent: 3 (pb)-1