Download
1 / 32
340 likes | 557 Vues
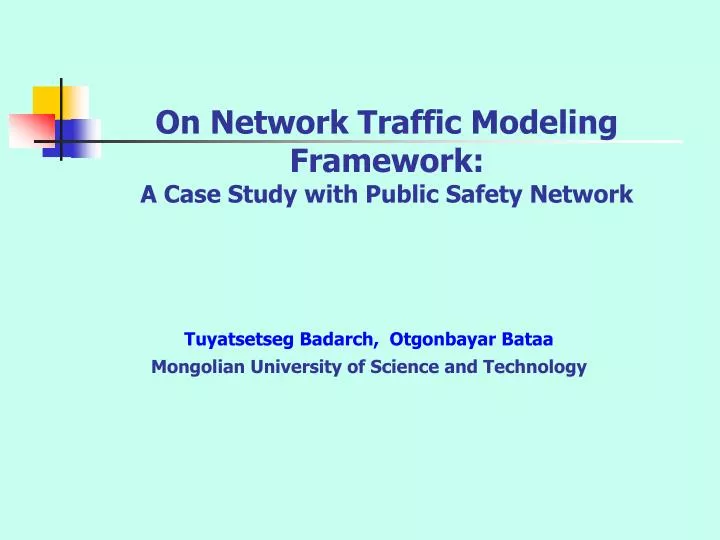
On Network Traffic Modeling Framework: A Case Study with Public Safety Network. Tuyatsetseg Badarch , Otgonbayar Bataa Mongolian University of Science and Technology. Contents “ Framework on network traffic probability models ”.

E N D
On Network Traffic Modeling Framework:A Case Study with Public Safety Network TuyatsetsegBadarch, OtgonbayarBataa Mongolian University of Science and Technology
Contents“Framework on network traffic probability models” Recent open issues for future research: “Framework on network traffic probability models” 1. Part I. Probability model: Simple standard or mixed advanced? How to overcome a spike and tail problem? Robust method? How we develop the good methods? Results of Public Safety Network 2. Part II. Probability model of blocking/delay: PSTN-Erlang formula or IP Erlang formula for loss and delay? An appropriate algorithm for IP Erlang formula? Good methods! Results of Public Safety Network 3. Part III. Traffic and Probability model connected to capacity and network planning GoS and capacity of a system? An appropriate algorithm for GoS, system capacity planning? Results of Public Safety Network 4. Results and the model validations in the case of Public Safety Network
PART I. Research Trends on Network Traffic Fitting Models Mixed models as traffic advanced models (mixed lognormals, mixed pareto, mixed erlangs, pareto plus lognormals….) Standard models as traffic candidate models (Lognormal model, Shifted Lognormal, Pareto model, Erlang model, Weibull model) On the world, there are 60 more standard models But for network traffic fitting model, these above named are exact candidates. … … … Studies are going on … … … Big issues on a spike, a tail
PART I. My Research work on this Network Traffic Fitting Models Mixed Advanced models (Mixed lognormals, mixed pareto, mixed erlangs, pareto plus lognormals….) Standard models as candidates (Lognormal model, Shifted Lognormal, Pareto model, Erlang model, Weibull model) … … … Studies are going on … … … …. 1. B. Tuyatsetseg, “Parametric-Expectation Maximization Approach for Call Holding Times of IP enabled Public Safety Networks.”WASET, Zurich, Switzerland, [online]. issue 73, pp. 568-575, Jan 2013. B. Tuyatsetseg, B. Otgonbayar, “Modeling Call Holding Times of Public Safety Network”,International Journal on Computational Science & Applications (IJCSA), Australia, vol. 3, no. 3, pp. 1-19, June 2013. B.Tuyatsetseg, B.Otgonbayar, “Traffic Modeling of Public Safety Network”, in Proc IEEE-APNOMS2013, Hiroshima , Japan. 25-27, Sep 2013 Big issues on a spike, a tail
The algorithm of my proposed mixed lognormal model, its performance on the Emergency Traffic Traffic random variables for ALGORITHM INPUT: the traffic values based on experiment or simulation Hidden traffic variables plus observed variables Initialize parameters 2. First step:evaluate 3. Second step : maximize where 4. Evaluate log likelihood, once likelihoods or parameters converge, the algorithm is done: Else Evaluate ex.values(3)using (1), (2) Iteratively maximize (3) Likelihood of lognormals (ex.values) (3) ALGORITHM OUTPUT: weights, scale, location parameters of all components
Challenging steps to develop a mixture lognormal model 1. MLE (3 parameters: weight, location and scale) through maximum log likelihood function. 2. The marginal distribution is described: through Bayesian theorem to compute the expression of unobserved traffic data that is iterative process untill likelihood or parameters converge 3. Theexpected value of complete traffic data set log likelihood through both the function of log likelihood and the marginal distribution.
Log likelihood computation of a mixture of lognormal parametric model Logn fn: Likelihood function: Loglikelihood function(to estimate the set of parameters for the mixed lognormal distributions that maximize the likelihood function. These formulas were proved mathematically in my previous journal publications.
…comparison on log likelihoods • MLE for simple lognormal distribution • MLE for a mixture of lognormal distributions: where indicator function for individual i that comes from the lognormal component with (1a) The formula was proved mathematically in my previous journal publications.
MLE parameters computation of a mixture of lognormals • The weights of a lognormal components (number of density in j divided by total number of density) • The means of a lognormal components (for each density i, its assignment mean to each j lognormal components) • The variance of lognormal components (for each density I, its assignment variance to each j lognormal components) (1) These formulas were proved mathematically in my previous journal publications.
Marginal distribution computation Bayesian analytical expression (2) is used to compute the marginal distribution, (posterior probability) of on and (2) evaluated at These formulas were proved mathematically in my previous journal publications.
Expected value computation The expected value (3) of the log likelihood is iterative, as a function of Bayesian and log likelihood function for (3) Marginal distribution (2) Log likelihoods of lognormals (1a) is the current value at iteration , for These formulas were proved mathematically in my previous journal publications.
The implementation algorithm performance , explanation by formulas Compute (3) ex.value using (1) weights or mixing. coeff (2) posterior prob. Iteratively maximize (3) independently This implementation algorithm is used in emergency incoming traffic simulation , with results in next pages.
The mixed model of traffic, its lognormal components of the proposed algorithm CHALLENGE: First of all, we should prove the exact formulas for MLE (weight, location, scale/shape) of the mixed log function MLE conditions: Location (mean) shape (var)
…. PART I. My research results: Mixed Advanced models (Mixed lognormals, mixed pareto, mixed erlangs, pareto plus lognormals….) Standard models as candidates (Lognormal model, Shifted Lognormal, Pareto model, Erlang model, Weibull model) … … … Studies are going on … … … …. 1. B. Tuyatsetseg, “Parametric-Expectation Maximization Approach for Call Holding Times of IP enabled Public Safety Networks.”WASET, Zurich, Switzerland, [online]. issue 73, pp. 568-575, Jan 2013. B. Tuyatsetseg, B. Otgonbayar, “Modeling Call Holding Times of Public Safety Network”,International Journal on Computational Science & Applications (IJCSA), Australia, vol. 3, no. 3, pp. 1-19, June 2013. B.Tuyatsetseg, B.Otgonbayar, “Traffic Modeling of Public Safety Network”, in Proc IEEE-APNOMS2013, Hiroshima , Japan. 25-27, Sep 2013 Big issues on a spike, a tail
The scenario of the existing Public Safety Network in Mongolia (EIN), its traffic mixed model results Mass traffic influences to emergency incoming traffic : Ambulance(103) Police (102) Fire (101) Hazard (105)
The comparison on TRAFFIC pattern of Mongolian EIN, some simple statistics Total 60 channels equally distributed but traffic has a huge difference. Emergency mass traffic: Ambulance call traffic (103): 57% 10275.45 seconds seamless Traffic value : 1.3 Erlangs Police call traffic (102): 38% 7150.692 seconds seamless Traffic value: 0.7 Erlangs Fire call traffic (101): 3.4 % 4664.076 seconds seamless Traffic value: 0.45 Erlangs Hazard call traffic (105) : 2.6 % 2532.098 seconds seamless Traffic value: 0.2 Erlangs for Mongolian biggest holiday and the continuous peak period traffic.
Part I. Numerical results of traffic mixed model: Results on Emergency Total traffic, Ambulance, Police, Fire, and Hazard incoming traffic Time series model Probability model
The model validation via Quantile-Quantile (Q-Q):Results on Emergency incoming traffic On Body/Head fitting validation On Tail validation,
PART II. Research Trends on Network probability of loss/delay for channels, links Erlang Traffic analysis for Video over IP (Robust probability model of loss/delay , its development??) Standard Erlang Traffic analysis : (Probability of Loss Probability of Delay) for wired and wireless conventional voice communications … … … Studies are going on … … … …. … … … for b=0:(z-1) factorial = prod(1:b); t = ((T)^b)/factorial; s=s + t; end … … … ….
PART II. Research on Network probability of blocked/delay for channels, links Erlang Traffic analysis for Video over IP (Robust probability model of loss/delay , its development??) This is one result of my research on the Video over IP transfer Standard Erlang Traffic analysis: (Probability of Loss Probability of Delay) for wired and wireless conventional voice communications Studies are going on … … … for b=0:(z-1) factorial = prod(1:b); t = ((T)^b)/factorial; s=s + t; end … … … ….
Why the Video over IP model? it’s application of Public Safety Network • Video surveillance based on real time monitoring using video camera for crime prevention. • The real time video delivering to the emergency center through IP network. • This Video over IP transfer is the exact one MASS Traffic producer in the case of PSN. For this reason, we have to model the exact computation method, algorithm to evaluate the performance of this Video over IP traffic. Hence the modeling of video over IP is the one main component of the framework.
Part II. Blocking/Delay probability analysis on Voice traffic to IP video traffic • IP Video Traffic : Probability of Loss and Probability of Delay • Average transfer time per frame in unit • Number of frames per unit, ( for ex, 25-30 frames in one sec for MPEG-4) • Packet frame arrival rate per unit • Packet frame transfer (Service) rate per unit • All resource utilization or traffic intensity for resources • Blocking and delay probability depends on erlang load Voice Traffic: Probability of Loss and Probability of Delay • The average holding time • The call arrival rate • The total number of available channel • The total number of calls Blocking and delay probability depends on erlang load ? Experiment Computation Experiment Simulation Computation Simulation
Video over IP Traffic Results Appropriate formulas for the proposed analysis • Loss of the video over IP depends on traffic • Delay of the video over IP depends on traffic Results: VBR method is most appropriate method than CBR for CCTV-Video over IP traffic loss/delay using
Video over IP Traffic simulation verification , Video over IP-Traffic loss analysis Results: VBR method is the most appropriate method to transfer video over IP than CBR for CCTV-Video over IP traffic loss/delay
Part III. On Traffic Capacity Region and network planning Fundamental theories for capacity region and network planning: • Queue theory , Markob theory , Erlang-C/Erlang-B theory Fundamental parameters for capacity region and network planning: • Call Conversation Time, • Arrival rate , • Service rate, • Probability models (optimum traffic model parameters, blocking and delay model parameters) Described parameters for Network capacity and planning: • Resource utilization, • Utilization efficiency, • Traffic load, • Number of links of queuing system, • Bandwidth, • Grade of Service , Sequence
The algorithm steps for a network traffic - capacity region and network planning The base chart for the traffic capacity region. (Call Holding Time per call, Number of calls per unit time, …Arrival rate , Service rate, Resource utilization, utilization efficiency, Traffic model parameters, number of links of queue system …) Probability of waiting , Grade of Service (GoS) should less than 1.) Second , third stages …….. based on Erlang load and probability of delay … other parameters Final stage First stage
0 Link numbers N=1 2 3 5 10 15 20 50 100 10 I region Ìàõ Average Traffic: Traffic: E=39.336 E=7.968 "103": GoS average level N=40 N=15 GoS= -1 10 GoS=0.0887 0.8786 II GoS region -2 10 Min Traffic: E=0.447 N=3 III GoS region =0.012 -3 10 -1 0 1 2 10 10 10 10 Traffic intensity (Erlang) RESULT ON EMERGENCY NETWORK CAPACITY REGION Peak/Congested period analysis: As a result of robust algorithm, we can get a chance to see Erlang capacity region for the system capacity and the net planning: Pc - Prob of delay E - Average of Traffic N - Number of emergency links/agent GoS - Grade of Service (GoS) , prob of waiting less than threshold level, secs
Model validation by four parameters (K-S test, pdf, cdf, ccdf) 1. Probability pdf results, parameters, weight coeff, 2. Head/body behavior results (cdf), 3. Tail behavior results (ccdf), 2. Kolmogorov Smirnov test (K-S), 3. Miminum D.max values (distance between proposed method and real data), 4. Minimum Error (the error of the model), 5. Convergence of the algorithm.
Results on more validation parameters(Emergency Ambulance case)
On contribution of my research This research’s contribution is complicated fundamental computational complicated tasks , as well as the implementation algorithm development, the study of Public Safety Network in Mongolia For me, 1. Mathematical formulas were proved and verified and then published in Switzerland and Australian computational journals in 2013 [1], [2], [3], [5] • In this conference, the traffic model framework. case study with Public Safety Network .The base algorithms were done for this process. Results were verified, 3. The contribution may be for fundamental area as well for network performance analysis and special application area. Also the algorithm of the approaches may be used in networks. 4. It may be one base method for dynamic bandwidth method/bandwidth provisioning because the model described traffic in detailed manner with main functions.
References • B. Tuyatsetseg, “Parametric Modeling Approach for Call Holding Times of IP based Public Safety Networks.”WASET. Switzerland, [online journal]. issue 73, pp. 568-575, Jan 2013. • B. Tuyatsetseg, B. Otgonbayar, “Modeling Call Holding Times of Public Safety Network”,International Journal on Computational Science & Applications (IJCSA), Australia, vol. 3, no. 3, pp. 1-19, June 2013. • B. Tuyatsetseg, B. Otgonbayar, “An Adaptive Scheduling Scheme to Efficient Emergency Call Holding Times in Public Safety Network,” in Proc. IFOST2013, Ulaanbaatar, Mongolia, June 28-July 3, 2013. • J. Wang, H. Zhou, L. Li, and F. Xu, “Accurate long-tailed network traffic approximation and its queueing analysis by hyper-Erlang distributions”, in Proc. IEEE conf. Local Computer Networks, pp. 148 - 155, 2005. • B.Tuyatsetseg, B.Otgonbayar, “Traffic Modeling of Public Safety Network”, in Proc IEEE-APNOMS2013, Hiroshima , Japan. 25-27, Sep . 2013.
Thank you for your attention Questions?