Download
1 / 30
300 likes | 446 Vues
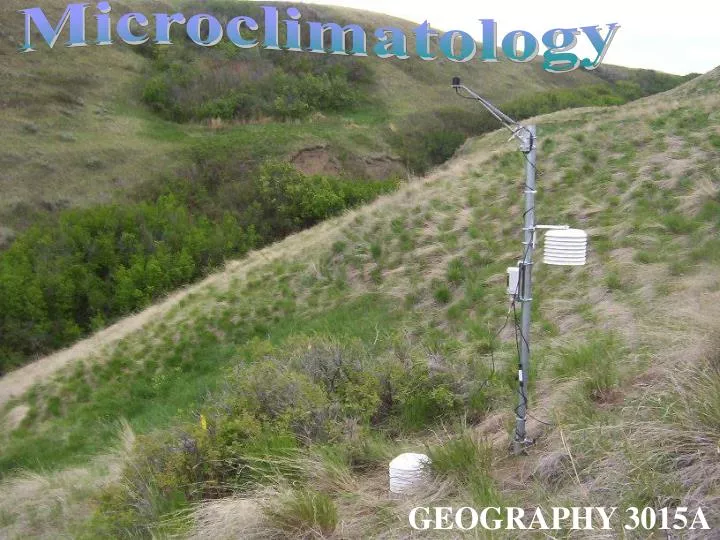
Microclimatology. GEOGRAPHY 3015A. ATMOSPHERIC. SCALES. Atmospheric Scales Vary in SPACE and TIME MICRO 10 -2 to 10 3 m Small-scale turbulence LOCAL 10 2 to 5x10 4 m Small to large cumulus cloud MESO 10 4 to 2x10 5 m Thunderstorms/Local winds MACRO 10 5 to 10 8 m

E N D
Microclimatology GEOGRAPHY 3015A
ATMOSPHERIC SCALES
Atmospheric Scales Vary in SPACE and TIME MICRO 10-2 to 103 m Small-scale turbulence LOCAL 102 to 5x10⁴ m Small to large cumulus cloud MESO 104 to 2x10⁵ m Thunderstorms/Local winds MACRO 105 to 108 m Hurricanes, cyclones, jet stream The Boundary Layer The portion of the atmosphere influenced by the Earth’s surface over a time period of one day Height: <100m to 2km Characteristics: Turbulence (i) frictional drag over surface (ii) convection Variable height (i) diurnal heating (ii) large scale weather systems affect stability See Fig 1.1, p. 4
Troposphere Extends to limit of surface influence (~10km) Atmospheric/Planetary Boundary Layer <100 m to 2km height (See previous page) Turbulent Surface Layer Intense small-scale turbulence from convection and friction ~ 50m by day, a few metres at night Roughness Layer Extends to 1-3+ times the height of surface elements Highly irregular flow Laminar Boundary Layer Non-turbulent, ~ 0.1-5 mm layer adhering to surface Vertical Extent See p. 5
ENERGY AND MASS EXCHANGES
The Earth-Atmosphere System First Law of Thermodynamics Energy can neither be created, nor destroyed Energy Input = Energy Output + Energy Storage Change The energy output is not necessarily in the same form as the energy input Modes of Energy Exchange in the Earth-Atmosphere System 1. Conduction 2. Convection 3. Radiation
RADIATION BALANCE
What happens to solar energy ? 1. Absorption (absorptivity=) Results in conduction, convection and long-wave emission 2. Transmission (transmissivity=) 3. Reflection (reflectivity=) + + = 1 The response varies with the surface type: Snowreflects 40 to 95% of solar energy and requires a phase change to increase above 0°C Forests and oceansabsorb more than dry lands (later we’ll see why dry lands still “heat up” more during the day) Water transmits solar energy and has a high heat capacity
Characteristics of Radiation Energy due to rapid oscillations of electromagnetic fields, transferred by photons The energy of a photon is equal to Planck’s constant, multiplied by the speed of light, divided by the wavelength All bodies above 0 K emit radiation Black body emits maximum possible radiation per unit area. Emissivity, = 1.0 All bodies have an emissivity between 0 and 1 E = hv
Temperature determines E, emitted Higher frequencies (shorter wavelengths) are emitted from bodies at a higher temperature Max Planck determined a characteristic emission curve whose shape is retained for radiation at 6000 K (Sun) and 288 K (Earth) Energy emitted = (T0)4 Radiant flux or flux density refers to the rate of flow of radiation per unit area (eg., Wm-2) Irradiance = incident radiant flux density Emittance = emitted radiant flux density
Wien’s Displacement Law As the temperature of a body increases, so does the total energy and the proportion of shorter wavelengths max = (2.88 x 10⁻³)/(T0) *wavelength in metres Sun max = 0.48 m Ultraviolet to infrared - 99% short-wave (0.15 to 3.0 m) Earth max = 10 m Infrared - 99% longwave (3.0 to 100 m)
Terrestrial radiation Solar radiation
Spectral Signatures
Atmospheric Windows window absorption
Diffuse (D) and Direct (S) Solar Radiation Clouds, water vapour, dust particles, salt crystals absorb and reflect some of the incoming solar radiation (K). Most is transmitted through clear skies (S) but some is scattered, resulting in a diffuse component (D) Clouds are very effective at scattering, resulting in D. The proportion of extraterrestrial radiation, Kext reflected, absorbed and transmitted define atmospheric reflectivity, a,absorptivity, a, and transmissivity, a
Diffuse Radiation Measured using a shade disk Radiation from entire sky except from within 3 of Sun
SOLAR RADIATION
S is weaker when the zenith angle is large S = Si cos Z Why ? The beam is simply spread out over a larger area (Figure 1.7, p. 15) The total short-wave radiation received at the surface (K) is defined as: K = S + D A proportion is reflected: K = K Net short-wave radiation, K*, is defined as follows: K* = K - K OR K* = K (1- )
FIeld Research Spatiotemporal patterns of plant ecophysiological stress in grassland, alpine krumholtz and riparian environments of southern Alberta Measurements: Microclimate stations (16) Photosynthesis processes (TPS-1) Fluorescence (FMS2) Reflectance (Unispec-SC) Sites: Lakeview Ridge, Waterton Lakes National Park (PI=Letts) Lethbridge Coulee Microclimate Station (PI=Letts) Pearce Corners Cottonwood Grove (PI=Rood) Lethbridge Flux Station (PI=Flanagan) Research Assistants: Davin Johnson, Kevin Nakonechny and Leslee Shenton
Pearce Corners Cottonwood Grove, (PI=Stew Rood)
Lethbridge Ecosystem Flux Site (PI = Larry Flanagan)