Download
1 / 21
210 likes | 346 Vues
Meteorological Evolution and Model Performance for Fire Threat Days Over the Northeast U.S. Joe Pollina 1,2 , Brian A. Colle 1 , Mike Erickson 1 1 School of Marine and Atmospheric Sciences Stony Brook University – SUNY 2 National Weather Service, New York City and and Joseph Charney

E N D
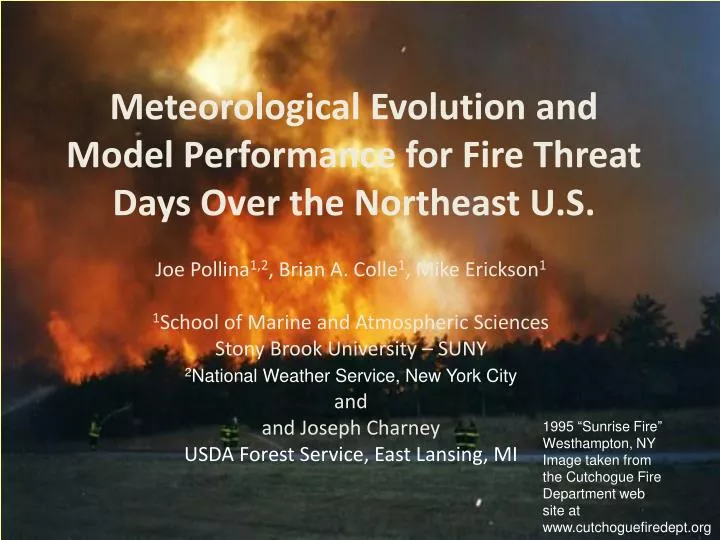
Meteorological Evolution and Model Performance for Fire Threat Days Over the Northeast U.S. Joe Pollina1,2, Brian A. Colle1, Mike Erickson1 1School of Marine and Atmospheric Sciences Stony Brook University – SUNY 2National Weather Service, New York City and and Joseph Charney USDA Forest Service, East Lansing, MI 1995 “Sunrise Fire” Westhampton, NY Image taken from the Cutchogue Fire Department web site at www.cutchoguefiredept.org
1999-Sep 2009 Fire Events (> 100 Acres) Over the Northeast U.S. (excluding PA and ME). 106 events total from the Northeast Interagency Coordination Center
Motivational Questions What is climatology of fire-threat days over the Northeast U.S.? No formal studies have been done for the entire Northeast. What are the large-scale flow patterns associated with fire threat days across the Northeast, and how do they evolve? What are the important physical processes that lead to the fire threat? How well do mesoscale models predict these fire threat conditions?
Data and Methods (Climatology) • Data (Jan. 1998-mid Sep. 2009) • Obtained 97 “fire threat” days which the National Fire Danger Rating System (NFDRS) indicates that the fire danger was “high, very high, or extreme”. This was obtained through the Wildland Fire Assessment System (WFAS) website: http://www.wfas.net/component/option,com_wrapper/Itemid,92/ • Methods • Monthly climatology of Fire Threat Days • Synoptic Flow Classification • Based on Yarnal (1993) • Large scale flow composite of the “fire threat” days • Used daily North American Regional Reanalysis (NARR) (Mesinger et al. 2006)
Monthly Climatology of Fire Threat Days Normalized Difference Vegetation Index for 2008 Apr 14 PERCENTAGE MONTH
Classification of Synoptic Weather Regimes • Used Yarnal (1993) classification system that was developed to describe the different types of surface pressure patterns associated with West Virginia fire events. • Applied 8 different types of weather patterns: • Pre-high (PH) • Back of high (BH) • Extended high (EH) • High pressure cell to the south (HS) • High pressure cell to the north (HN) • Cyclonic conditions with rain (RC) • Cold front passage (CF) • Elongated low (EL)
H L H H H H Pre-high Back of high Extended high
L H L H High to the south High to the north
Distribution of Fire Threat Days For Each Yarnal Synoptic Type PH=pre-high EH=extended high BH=back of high CF=cold front HS=high to south HN=high to north PERCENTAGE YARNAL CLASSIFICATION
Distribution of Synoptic Type By Month (pre-high) (extended high) (back of high) (cold front) (high to the south) Percentage (high to the north) Overall: PH: 39.2% EH: 29.9% BH: 20.6% CF: 5.2% HS: 3.1% HN: 2.1% Month
NARR Composite of All Fire Threat Days SLP 500Z 48 hours prior to events 24 hours prior to events Day of the events
NARR Composite of All Fire Threat Days Relatively dry and Deep PBL (Well-Mixed) 850-mb Relative Humidity (%) Composite PBL Height (m)
NARR Composite of All Fire Threat Days Additional Subsidence from Terrain Composite 900 mb Wind Vector Composite 2m RH
15-17 April 2008 Overlooks (NY) Fire Event Overlooks Fire 04/15/12z 04/16/12z 04/17/12z 04/15/12z 04/16/12z 04/17/12z
Drying and Warming at Albany, NY (4/14-4/17) 1200 UTC 14 April 2008 0000 UTC 18 April 2008 Surface RH and wind observations for central and southern NY
Origin of the Dry Air Backward trajectory (every 24 h) starting at 12 UTC 17 April 2008 Using Hybrid Single-Particle Lagrangian Integrated Trajectory (HYSPLIT) program (Draxler and Rolph 2003). This shows where the dry air was 315 hours prior to the event, and the path it took up to the time of the event. 4/5 00 UTC 4/6 4/7 4/8 4/12 4/9 4/14 4/10 4/11 4/13 4/15 4/16 4/17 4/17 12 UTC 4/16 00 UTC 4/16 00 UTC 4/17 12 UTC 4/17 12 UTC
Short-Range Ensemble Systems Stony Brook Univ. 13 Member Ensemble (00 UTC) - 7 MM5, 6 WRFv2.2 members at 12 km grid spacing (NAM soil moisture and SST). - IC: NAM, GFS, CMC and NOGAPS. - CP: Grell, KF and Betts-Miller. - PBL MM5: Blackadar, MRF, MY - PBL WRF: MYJ and YSU. - MP MM5: Sice, Reis2 - MP WRF: Ferrier, WSM3. NCEP SREF 21 Member (21 UTC) - 10 ETA members at 32 km grid spacing. - 5 with BMJ CP and Ferrier MP. - 5 with KF CP and Ferrier MP. - 5 RSM members at 45 km grid spacing. - 3 with SAS CP and Zhou GFS MP. - 2 with RAS CP and Zhou GFS MP. - 3 WRF-NMM members at 40 km grid spacing. - 3 WRF-ARW members at 45 km grid spacing. - IC's are perturbed using a breeding technique. • Verification of surface parameters (e.g., 2-m temp and 10-m wsp) for 109 NWS stations over NE for March-Sept 2006-2009
Surface Temperature Mean Error (12-36h) by Member for Stony Brook and SREF Ensembles MYJ SBU 12-km Ensemble NCEP SREF (oC) (oC) SREF sub-group averages WRF MM5
Impact of Using Previous 5 Fire Threat Days for Bias Correction of Surface Temperature (12-36 h avg) SBU 12-km Ensemble NCEP SREF (oC) (oC) WRF MM5 Note: MAE for SBU+SREF ens mean is 1.84 K (~0.10 K less than best member, but comparable to SBU mean).
NARR Composite of Top 10 Largest and Smallest Cool Bias on Fire Threat Days Sea-level pressure (Pa) Large T Bias Small T Bias Cloud Fraction (%): Cool bias associated with partly cloudy fire threat days – model too cloudy??. Large T Bias Small T Bias
Conclusions • Peak fire threat over the Northeast U.S. occurs during the climatological spring (~52% of events in April). This is the pre green-up period. • Fire threat days were classified by synoptic type. Pre-high (39%), extended high (30%), and back of high (21%) are the major synoptic patterns associated with a high fire threat. • NARR composites illustrate high pressure moving south from Canada to the Northeast U.S., with a corresponding ridge at 500 mb approaching the Great Lakes. • Downsloping from northwesterly flow, subsidence from high pressure, and mixing from large PBL heights are all likely important in bringing in warmer, drier air to the surface. • Ensembles have relatively large (cool) biases for fire threat days over the Northeast U.S., which are larger than the average warm season biases. • A standard 14-day bias correction (used by many studies) does not work that well for fire threat days (since weather is more anomalous). A bias correction using last 5 fire threat days removes most of ensemble bias.